Charter 2003 Annual Report Download - page 58
Download and view the complete annual report
Please find page 58 of the 2003 Charter annual report below. You can navigate through the pages in the report by either clicking on the pages listed below, or by using the keyword search tool below to find specific information within the annual report.-
 1
1 -
2
-
3
-
4
-
5
-
6
-
7
-
8
-
9
-
10
-
11
-
12
-
13
-
14
-
15
-
16
-
17
-
18
-
19
-
20
-
21
-
22
-
23
-
24
-
25
-
26
-
27
-
28
-
29
-
30
-
31
-
32
-
33
-
34
-
35
-
36
-
37
-
38
-
39
-
40
-
41
-
42
-
43
-
44
-
45
-
46
-
47
-
 48
48 -
 49
49 -
 50
50 -
 51
51 -
 52
52 -
 53
53 -
 54
54 -
 55
55 -
 56
56 -
 57
57 -
 58
58 -
 59
59 -
 60
60 -
 61
61 -
 62
62 -
 63
63 -
 64
64 -
 65
65 -
 66
66 -
 67
67 -
 68
68 -
69
-
70
-
71
-
72
-
73
-
74
-
75
-
76
-
77
-
78
-
79
-
80
-
81
-
82
-
83
-
84
-
85
-
86
-
87
-
88
-
89
-
90
-
91
-
92
-
93
-
94
-
95
-
96
-
97
-
98
-
99
-
100
-
101
-
102
-
103
-
104
-
105
-
106
-
107
-
108
-
109
-
110
-
111
-
112
-
113
-
114
-
115
-
116
-
117
-
118
-
119
-
120
-
121
-
122
-
123
-
124
-
125
-
126
-
127
-
128
-
129
-
130
-
131
-
132
-
133
-
134
-
135
-
136
-
137
-
138
-
139
-
140
-
141
-
142
-
143
-
144
-
145
-
146
-
147
-
148
-
149
-
150
-
151
-
152
-
153
 |
 |

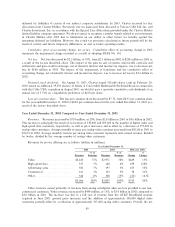
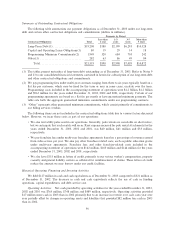
Summary of Outstanding Contractual Obligations
The following table summarizes our payment obligations as of December 31, 2003 under our long-term
debt and certain other contractual obligations and commitments (dollars in millions).
Payments by Period
Less than 1-3 3-5 More than
Contractual Obligations Total 1 year years years 5 years
Long-Term Debt(1)ÏÏÏÏÏÏÏÏÏÏÏÏÏÏÏÏÏÏÏÏ $19,208 $188 $2,199 $6,293 $10,528
Capital and Operating Lease Obligations(1) 80 19 29 14 18
Programming Minimum Commitments(2) 1,949 320 684 703 242
Other(3) ÏÏÏÏÏÏÏÏÏÏÏÏÏÏÏÏÏÏÏÏÏÏÏÏÏÏÏÏÏ 282 63 86 49 84
Total ÏÏÏÏÏÏÏÏÏÏÏÏÏÏÏÏÏÏÏÏÏÏÏÏÏÏÏÏÏ $21,519 $590 $2,998 $7,059 $10,872
(1) The tables present maturities of long-term debt outstanding as of December 31, 2003. Refer to Notes 9
and 23 to our consolidated Ñnancial statements contained in herein for a description of our long-term debt
and other contractual obligations and commitments.
(2) We pay programming fees under multi-year contracts ranging from three to six years typically based on a
Öat fee per customer, which may be Ñxed for the term or may in some cases, escalate over the term.
Programming costs included in the accompanying statement of operations were $1.2 billion, $1.2 billion
and $963 million for the years ended December 31, 2003, 2002 and 2001, respectively. Certain of our
programming agreements are based on a Öat fee per month or have guaranteed minimum payments. The
table sets forth the aggregate guaranteed minimum commitments under our programming contracts.
(3) ""Other'' represents other guaranteed minimum commitments, which consist primarily of commitments to
our billing services vendors.
The following items are not included in the contractual obligations table due to various factors discussed
below. However, we incur these costs as part of our operations:
‚ We also rent utility poles used in our operations. Generally, pole rentals are cancelable on short notice,
but we anticipate that such rentals will recur. Rent expense incurred for pole rental attachments for the
years ended December 31, 2003, 2002 and 2001, was $40 million, $41 million and $33 million,
respectively.
‚ We pay franchise fees under multi-year franchise agreements based on a percentage of revenues earned
from video service per year. We also pay other franchise related costs, such as public education grants
under multi-year agreements. Franchise fees and other franchise-related costs included in the
accompanying statement of operations were $162 million, $160 million and $144 million for the years
ended December 31, 2003, 2002 and 2001, respectively.
‚ We also have $153 million in letters of credit, primarily to our various worker's compensation, property
casualty and general liability carriers as collateral for reimbursement of claims. These letters of credit
reduce the amount we may borrow under our credit facilities.
Historical Operating, Financing and Investing Activities
We held $127 million in cash and cash equivalents as of December 31, 2003 compared to $321 million as
of December 31, 2002. The decrease in cash and cash equivalents reÖects the use of cash in funding
operations, capital expenditures and debt service cost.
Operating Activities. Net cash provided by operating activities for the years ended December 31, 2003,
2002 and 2001 was $765 million, $748 million and $489 million, respectively. Operating activities provided
$17 million more cash in 2003 than in 2002 primarily due to an increase in revenue over cash costs year over
year partially oÅset by changes in operating assets and liabilities that provided $82 million less cash in 2003
than in 2002.
56