Charter 2003 Annual Report Download - page 97
Download and view the complete annual report
Please find page 97 of the 2003 Charter annual report below. You can navigate through the pages in the report by either clicking on the pages listed below, or by using the keyword search tool below to find specific information within the annual report.-
 1
1 -
2
-
3
-
4
-
5
-
6
-
7
-
8
-
9
-
10
-
11
-
12
-
13
-
14
-
15
-
16
-
17
-
18
-
19
-
20
-
21
-
22
-
23
-
24
-
25
-
26
-
27
-
28
-
29
-
30
-
31
-
32
-
33
-
34
-
35
-
36
-
37
-
38
-
39
-
40
-
41
-
42
-
43
-
44
-
45
-
46
-
47
-
48
-
49
-
50
-
51
-
52
-
53
-
54
-
55
-
56
-
57
-
58
-
59
-
60
-
61
-
62
-
63
-
64
-
65
-
66
-
67
-
68
-
69
-
70
-
71
-
72
-
73
-
74
-
75
-
76
-
77
-
78
-
79
-
80
-
81
-
82
-
83
-
84
-
85
-
86
-
 87
87 -
 88
88 -
 89
89 -
 90
90 -
 91
91 -
 92
92 -
 93
93 -
 94
94 -
 95
95 -
 96
96 -
 97
97 -
 98
98 -
 99
99 -
 100
100 -
 101
101 -
 102
102 -
 103
103 -
 104
104 -
 105
105 -
 106
106 -
 107
107 -
108
-
109
-
110
-
111
-
112
-
113
-
114
-
115
-
116
-
117
-
118
-
119
-
120
-
121
-
122
-
123
-
124
-
125
-
126
-
127
-
128
-
129
-
130
-
131
-
132
-
133
-
134
-
135
-
136
-
137
-
138
-
139
-
140
-
141
-
142
-
143
-
144
-
145
-
146
-
147
-
148
-
149
-
150
-
151
-
152
-
153
 |
 |

December 31, 2003 and 2002, respectively. The fair value of high-yield debt and bank debt is based on quoted
market prices.
We have certain interest rate derivative instruments that have been designated as cash Öow hedging
instruments. Such instruments are those which eÅectively convert variable interest payments on certain debt
instruments into Ñxed payments. For qualifying hedges, SFAS No. 133 allows derivative gains and losses to
oÅset related results on hedged items in the consolidated statement of operations. We have formally
documented, designated and assessed the eÅectiveness of transactions that receive hedge accounting. For the
years ended December 31, 2003, 2002 and 2001, net gain (loss) on derivative instruments and hedging
activities includes gains of $8 million and losses of $14 million and $2 million, respectively, which represent
cash Öow hedge ineÅectiveness on interest rate hedge agreements arising from diÅerences between the critical
terms of the agreements and the related hedged obligations. Changes in the fair value of interest rate
agreements designated as hedging instruments of the variability of cash Öows associated with Öoating-rate debt
obligations are reported in accumulated other comprehensive loss. For the years ended December 31, 2003,
2002 and 2001, a gain of $48 million and losses of $65 million and $39 million, respectively, related to
derivative instruments designated as cash Öow hedges were recorded in accumulated other comprehensive loss
and minority interest. The amounts are subsequently reclassiÑed into interest expense as a yield adjustment in
the same period in which the related interest on the Öoating-rate debt obligations aÅects earnings (losses).
Certain interest rate derivative instruments are not designated as hedges, as they do not meet the
eÅectiveness criteria speciÑed by SFAS No. 133. However, we believe such instruments are closely correlated
with the respective debt, thus managing associated risk. Interest rate derivative instruments not designated as
hedges are marked to fair value with the impact recorded as gain (loss) on derivative instruments and hedging
activities in our statements of operations. For the years ended December 31, 2003, 2002 and 2001, net gain
(loss) on derivative instruments and hedging activities includes gains of $57 million and losses of $101 million
and $48 million, respectively, for interest rate derivative instruments not designated as hedges.
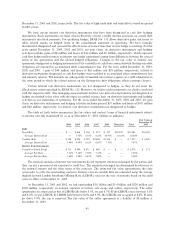
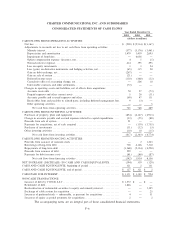
The table set forth below summarizes the fair values and contract terms of Ñnancial instruments subject
to interest rate risk maintained by us as of December 31, 2003 (dollars in millions):
Fair Value at
December 31,
2004 2005 2006 2007 2008 Thereafter Total 2003
Debt
Fixed Rate ÏÏÏÏÏÏÏÏÏÏÏÏÏÏÏÏÏÏÏÏÏÏÏÏ $ Ì $ 618 $ 156 $ 451 $ 227 $10,529 $11,981 $10,590
Average Interest Rate ÏÏÏÏÏÏÏÏÏÏÏÏÏ Ì 5.75% 4.75% 8.25% 10.93% 10.43% 10.04%
Variable RateÏÏÏÏÏÏÏÏÏÏÏÏÏÏÏÏÏÏÏÏÏÏ $ 188 $ 426 $ 999 $2,080 $3,534 $ Ì $ 7,227 $ 6,949
Average Interest Rate ÏÏÏÏÏÏÏÏÏÏÏÏÏ 3.40% 4.99% 6.12% 6.85% 7.91% Ì 7.07%
Interest Rate Instruments
Variable to Fixed SwapsÏÏÏÏÏÏÏÏÏÏÏÏÏ $ 715 $ 990 $ 873 $ 400 $ Ì $ Ì $ 2,978 $ 171
Average Pay Rate ÏÏÏÏÏÏÏÏÏÏÏÏÏÏÏÏ 7.36% 7.10% 7.30% 7.35% Ì Ì 7.25%
Average Receive RateÏÏÏÏÏÏÏÏÏÏÏÏÏ 3.68% 5.28% 6.43% 7.00% Ì Ì 5.46%
The notional amounts of interest rate instruments do not represent amounts exchanged by the parties and,
thus, are not a measure of our exposure to credit loss. The amounts exchanged are determined by reference to
the notional amount and the other terms of the contracts. The estimated fair value approximates the costs
(proceeds) to settle the outstanding contracts. Interest rates on variable debt are estimated using the average
implied forward London Interbank OÅering Rate (LIBOR) rates for the year of maturity based on the yield
curve in eÅect at December 31, 2003.
At December 31, 2003 and 2002, we had outstanding $3.0 billion and $3.4 billion and $520 million and
$520 million, respectively, in notional amounts of interest rate swaps and collars, respectively. The collar
agreements are structured so that if LIBOR falls below 5.3%, we pay 6.7%. If the LIBOR rate is between 5.3%
and 8.0%, we pay LIBOR. If LIBOR falls between 8.0% and 9.9%, the LIBOR rate is capped at 8.0%. If rates
go above 9.9%, the cap is removed. The fair value of the collar agreements is a liability of $8 million at
December 31, 2003.
95