Charter 2003 Annual Report Download - page 30
Download and view the complete annual report
Please find page 30 of the 2003 Charter annual report below. You can navigate through the pages in the report by either clicking on the pages listed below, or by using the keyword search tool below to find specific information within the annual report.-
 1
1 -
2
-
3
-
4
-
5
-
6
-
7
-
8
-
9
-
10
-
11
-
12
-
13
-
14
-
15
-
16
-
17
-
18
-
19
-
 20
20 -
 21
21 -
 22
22 -
 23
23 -
 24
24 -
 25
25 -
 26
26 -
 27
27 -
 28
28 -
 29
29 -
 30
30 -
 31
31 -
 32
32 -
 33
33 -
 34
34 -
 35
35 -
 36
36 -
 37
37 -
 38
38 -
 39
39 -
 40
40 -
41
-
42
-
43
-
44
-
45
-
46
-
47
-
48
-
49
-
50
-
51
-
52
-
53
-
54
-
55
-
56
-
57
-
58
-
59
-
60
-
61
-
62
-
63
-
64
-
65
-
66
-
67
-
68
-
69
-
70
-
71
-
72
-
73
-
74
-
75
-
76
-
77
-
78
-
79
-
80
-
81
-
82
-
83
-
84
-
85
-
86
-
87
-
88
-
89
-
90
-
91
-
92
-
93
-
94
-
95
-
96
-
97
-
98
-
99
-
100
-
101
-
102
-
103
-
104
-
105
-
106
-
107
-
108
-
109
-
110
-
111
-
112
-
113
-
114
-
115
-
116
-
117
-
118
-
119
-
120
-
121
-
122
-
123
-
124
-
125
-
126
-
127
-
128
-
129
-
130
-
131
-
132
-
133
-
134
-
135
-
136
-
137
-
138
-
139
-
140
-
141
-
142
-
143
-
144
-
145
-
146
-
147
-
148
-
149
-
150
-
151
-
152
-
153
 |
 |

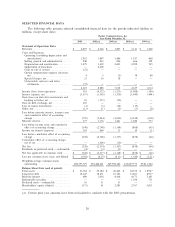
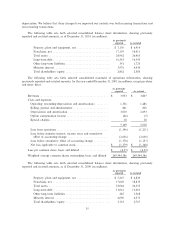
SELECTED FINANCIAL DATA
The following table presents selected consolidated Ñnancial data for the periods indicated (dollars in
millions, except share data):
Charter Communications, Inc.
Year Ended December 31,
2003 2002(a) 2001(a) 2000(a) 1999(a)
Statement of Operations Data:
Revenues ÏÏÏÏÏÏÏÏÏÏÏÏÏÏÏÏÏÏÏÏÏÏÏÏÏÏÏÏÏ $ 4,819 $ 4,566 $ 3,807 $ 3,141 $ 1,428
Costs and Expenses:
Operating (excluding depreciation and
amortization) ÏÏÏÏÏÏÏÏÏÏÏÏÏÏÏÏÏÏÏÏÏ 1,952 1,807 1,486 1,187 460
Selling, general and administrativeÏÏÏÏÏÏ 940 963 826 606 329
Depreciation and amortization ÏÏÏÏÏÏÏÏÏ 1,479 1,439 2,693 2,398 745
Impairment of franchisesÏÏÏÏÏÏÏÏÏÏÏÏÏÏ Ì 4,638 Ì Ì Ì
Gain on sale of system ÏÏÏÏÏÏÏÏÏÏÏÏÏÏÏ (21) Ì Ì Ì Ì
Option compensation expense (income),
net ÏÏÏÏÏÏÏÏÏÏÏÏÏÏÏÏÏÏÏÏÏÏÏÏÏÏÏÏÏÏ 4 5 (5) 38 80
Special charges, net ÏÏÏÏÏÏÏÏÏÏÏÏÏÏÏÏÏÏ 21 36 18 Ì Ì
Unfavorable contracts and other
settlements ÏÏÏÏÏÏÏÏÏÏÏÏÏÏÏÏÏÏÏÏÏÏÏ (72) Ì Ì Ì Ì
4,303 8,888 5,018 4,229 1,614
Income (loss) from operations ÏÏÏÏÏÏÏÏÏÏÏ 516 (4,322) (1,211) (1,088) (186)
Interest expense, net ÏÏÏÏÏÏÏÏÏÏÏÏÏÏÏÏÏÏÏ (1,557) (1,503) (1,310) (1,040) (444)
Gain (loss) on derivative instruments and
hedging activities, net ÏÏÏÏÏÏÏÏÏÏÏÏÏÏÏÏ 65 (115) (50) Ì Ì
Gain on debt exchange, net ÏÏÏÏÏÏÏÏÏÏÏÏÏ 267ÌÌÌÌ
Loss on equity investments ÏÏÏÏÏÏÏÏÏÏÏÏÏÏ (3) (3) (54) (19) Ì
Other, net ÏÏÏÏÏÏÏÏÏÏÏÏÏÏÏÏÏÏÏÏÏÏÏÏÏÏÏÏ (13) (1) (5) (1) (8)
Loss before minority interest, income taxes
and cumulative eÅect of accounting
change ÏÏÏÏÏÏÏÏÏÏÏÏÏÏÏÏÏÏÏÏÏÏÏÏÏÏÏÏÏ (725) (5,944) (2,630) (2,148) (638)
Minority interestÏÏÏÏÏÏÏÏÏÏÏÏÏÏÏÏÏÏÏÏÏÏÏ 377 3,176 1,461 1,280 573
Loss before income taxes and cumulative
eÅect of accounting changeÏÏÏÏÏÏÏÏÏÏÏÏ (348) (2,768) (1,169) (868) (65)
Income tax beneÑt (expense)ÏÏÏÏÏÏÏÏÏÏÏÏ 110 460 12 10 (1)
Loss before cumulative eÅect of accounting
change ÏÏÏÏÏÏÏÏÏÏÏÏÏÏÏÏÏÏÏÏÏÏÏÏÏÏÏÏÏ (238) (2,308) (1,157) (858) (66)
Cumulative eÅect of accounting change,
net of taxÏÏÏÏÏÏÏÏÏÏÏÏÏÏÏÏÏÏÏÏÏÏÏÏÏÏÏ Ì (206) (10) Ì Ì
Net loss ÏÏÏÏÏÏÏÏÏÏÏÏÏÏÏÏÏÏÏÏÏÏÏÏÏÏÏÏÏÏ (238) (2,514) (1,167) (858) (66)
Dividends on preferred stock Ì redeemable (4) (3) (1) Ì Ì
Net loss applicable to common stock ÏÏÏÏÏ $ (242) $ (2,517) $ (1,168) $ (858) $ (66)
Loss per common share, basic and diluted $ (0.82) $ (8.55) $ (4.33) $ (3.80) $ (2.22)
Weighted-average common shares
outstanding ÏÏÏÏÏÏÏÏÏÏÏÏÏÏÏÏÏÏÏÏÏÏÏÏÏ 294,597,519 294,440,261 269,594,386 225,697,775 29,811,202
Balance Sheet Data (end of period):
Total assets ÏÏÏÏÏÏÏÏÏÏÏÏÏÏÏÏÏÏÏÏÏÏÏÏÏÏÏ $ 21,364 $ 22,384 $ 26,463 $ 24,352 $ 18,967
Long-term debtÏÏÏÏÏÏÏÏÏÏÏÏÏÏÏÏÏÏÏÏÏÏÏÏ 18,647 18,671 16,343 13,061 8,937
Minority interestÏÏÏÏÏÏÏÏÏÏÏÏÏÏÏÏÏÏÏÏÏÏÏ 689 1,050 4,434 4,571 5,381
Redeemable securities ÏÏÏÏÏÏÏÏÏÏÏÏÏÏÏÏÏÏ Ì Ì Ì 1,104 751
Preferred stock Ì redeemable ÏÏÏÏÏÏÏÏÏÏÏ 55 51 51 Ì Ì
Shareholders' equity (deÑcit) ÏÏÏÏÏÏÏÏÏÏÏÏ (175) 41 2,585 2,767 3,011
(a) Certain prior year amounts have been reclassiÑed to conform with the 2003 presentation.
28