Charter 2003 Annual Report Download - page 47
Download and view the complete annual report
Please find page 47 of the 2003 Charter annual report below. You can navigate through the pages in the report by either clicking on the pages listed below, or by using the keyword search tool below to find specific information within the annual report.-
 1
1 -
2
-
3
-
4
-
5
-
6
-
7
-
8
-
9
-
10
-
11
-
12
-
13
-
14
-
15
-
16
-
17
-
18
-
19
-
20
-
21
-
22
-
23
-
24
-
25
-
26
-
27
-
28
-
29
-
30
-
31
-
32
-
33
-
34
-
35
-
36
-
 37
37 -
 38
38 -
 39
39 -
 40
40 -
 41
41 -
 42
42 -
 43
43 -
 44
44 -
 45
45 -
 46
46 -
 47
47 -
 48
48 -
 49
49 -
 50
50 -
 51
51 -
 52
52 -
 53
53 -
 54
54 -
 55
55 -
 56
56 -
 57
57 -
58
-
59
-
60
-
61
-
62
-
63
-
64
-
65
-
66
-
67
-
68
-
69
-
70
-
71
-
72
-
73
-
74
-
75
-
76
-
77
-
78
-
79
-
80
-
81
-
82
-
83
-
84
-
85
-
86
-
87
-
88
-
89
-
90
-
91
-
92
-
93
-
94
-
95
-
96
-
97
-
98
-
99
-
100
-
101
-
102
-
103
-
104
-
105
-
106
-
107
-
108
-
109
-
110
-
111
-
112
-
113
-
114
-
115
-
116
-
117
-
118
-
119
-
120
-
121
-
122
-
123
-
124
-
125
-
126
-
127
-
128
-
129
-
130
-
131
-
132
-
133
-
134
-
135
-
136
-
137
-
138
-
139
-
140
-
141
-
142
-
143
-
144
-
145
-
146
-
147
-
148
-
149
-
150
-
151
-
152
-
153
 |
 |

Year Ended December 31, 2003 Compared to Year Ended December 31, 2002
Revenues. Revenues increased by $253 million, or 6%, from $4.6 billion for the year ended Decem-
ber 31, 2002 to $4.8 billion for the year ended December 31, 2003. This increase is principally the result of an
increase of 427,500 high-speed data customers, as well as price increases for video and high-speed data
services, and is oÅset partially by a decrease of 147,500 and 10,900 in analog and digital video customers,
respectively. Included within the decrease of analog and digital video customers and reducing the increase of
high-speed data customers are 25,500 analog video customers, 12,500 digital video customers and 12,200 high-
speed data customers sold in the Port Orchard, Washington sale on October 1, 2003. Our goal is to increase
revenues by mitigating our past analog video customer losses, implementing limited price increases on certain
services and packages and increasing revenues from incremental high-speed data services, digital video and
advanced products and services such as digital video recorders, high deÑnition television, VOD and telephony
using VOIP to our existing customer base and commercial customers.
Average monthly revenue per analog video customer increased from $56.91 for the year ended
December 31, 2002 to $61.92 for the year ended December 31, 2003. Average monthly revenue per analog
video customer represents total annual revenue, divided by twelve, divided by the average number of analog
video customers.
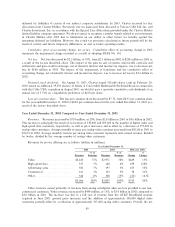
Revenues by service oÅering are as follows (dollars in millions):
Year Ended December 31,
2003 2002 2003 over 2002
% of % of %
Revenues Revenues Revenues Revenues Change Change
VideoÏÏÏÏÏÏÏÏÏÏÏÏÏÏÏÏÏÏÏÏÏÏÏÏÏÏ $3,461 72% $3,420 75% $ 41 1%
High-speed dataÏÏÏÏÏÏÏÏÏÏÏÏÏÏÏÏÏ 556 12% 337 7% 219 65%
Advertising sales ÏÏÏÏÏÏÏÏÏÏÏÏÏÏÏÏ 263 5% 302 7% (39) (13)%
Commercial ÏÏÏÏÏÏÏÏÏÏÏÏÏÏÏÏÏÏÏÏ 204 4% 161 3% 43 27%
OtherÏÏÏÏÏÏÏÏÏÏÏÏÏÏÏÏÏÏÏÏÏÏÏÏÏÏ 335 7% 346 8% (11) (3)%
$4,819 100% $4,566 100% $253 6%
Video revenues consist primarily of revenues from analog and digital video services provided to our non-
commercial customers. Video revenues increased by $41 million, or 1%, for the year ended December 31, 2003
compared to the year ended December 31, 2002. The increase was primarily due to price increases partially
oÅset by a decline in analog and digital video customers.
Revenues from high-speed data services provided to our non-commercial customers increased $219 mil-
lion, or 65%, from $337 million for the year ended December 31, 2002 to $556 million for the year ended
December 31, 2003. Approximately 93% of the increase related to the increase in the average number of
customers, whereas approximately 7% related to the increase in average price of the service. The increase was
primarily due to the addition of high-speed data customers within our existing service areas. We were also able
to oÅer this service to more of our customers, as the estimated percentage of homes passed that could receive
high-speed data service increased from 82% as of December 31, 2002 to 87% as of December 31, 2003 as a
result of our system upgrades.
Advertising sales revenues consist primarily of revenues from commercial advertising customers,
programmers and other vendors. Advertising sales decreased $39 million, or 13%, from $302 million for the
year ended December 31, 2002, to $263 million for the year ended December 31, 2003 primarily as a result of
a decrease in advertising from vendors oÅset partially by an increase in local advertising sales revenues. For the
years ended December 31, 2003 and 2002, we received $15 million and $79 million, respectively, in advertising
revenue from vendors.
Commercial revenues consist primarily of revenues from video and high-speed data services to our
commercial customers. Commercial revenues increased $43 million, or 27%, from $161 million for the year
45