Charter 2003 Annual Report Download - page 7
Download and view the complete annual report
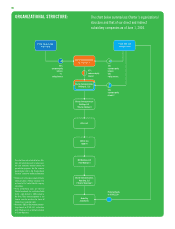
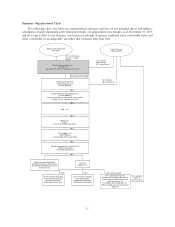
Please find page 7 of the 2003 Charter annual report below. You can navigate through the pages in the report by either clicking on the pages listed below, or by using the keyword search tool below to find specific information within the annual report.-
 1
1 -
 2
2 -
 3
3 -
 4
4 -
 5
5 -
 6
6 -
 7
7 -
 8
8 -
 9
9 -
 10
10 -
 11
11 -
 12
12 -
 13
13 -
 14
14 -
 15
15 -
 16
16 -
 17
17 -
 18
18 -
19
-
20
-
21
-
22
-
23
-
24
-
25
-
26
-
27
-
28
-
29
-
30
-
31
-
32
-
33
-
34
-
35
-
36
-
37
-
38
-
39
-
40
-
41
-
42
-
43
-
44
-
45
-
46
-
47
-
48
-
49
-
50
-
51
-
52
-
53
-
54
-
55
-
56
-
57
-
58
-
59
-
60
-
61
-
62
-
63
-
64
-
65
-
66
-
67
-
68
-
69
-
70
-
71
-
72
-
73
-
74
-
75
-
76
-
77
-
78
-
79
-
80
-
81
-
82
-
83
-
84
-
85
-
86
-
87
-
88
-
89
-
90
-
91
-
92
-
93
-
94
-
95
-
96
-
97
-
98
-
99
-
100
-
101
-
102
-
103
-
104
-
105
-
106
-
107
-
108
-
109
-
110
-
111
-
112
-
113
-
114
-
115
-
116
-
117
-
118
-
119
-
120
-
121
-
122
-
123
-
124
-
125
-
126
-
127
-
128
-
129
-
130
-
131
-
132
-
133
-
134
-
135
-
136
-
137
-
138
-
139
-
140
-
141
-
142
-
143
-
144
-
145
-
146
-
147
-
148
-
149
-
150
-
151
-
152
-
153
 |
 |

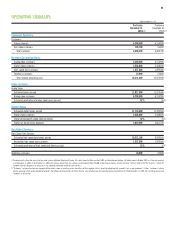
OPERATING SUMMARY:
Approximate as of
Pro Forma Pro Forma
December 31, December 31,
2003(a,b) 2002(a,b)
Customer Summary:
Customers:
Video customers 6,200,500 6,314,900
Non-video customers 105,700 54,800
Total customers 6,306,200 6,369,700
Revenue Generating Units:
Analog video customers 6,200,500 6,314,900
Digital video customers 2,588,600 2,588,200
High-speed data customers 1,527,800 1,099,000
Telephony customers 24,900 22,800
Total revenue generating units 10,341,800 10,024,900
Video Services:
Analog Video:
Estimated homes passed 11,817,500 11,579,000
Analog video customers 6,200,500 6,314,900
Estimated penetration of analog video homes passed 52% 55%
Digital Video:
Estimated digital homes passed 11,716,400 11,395,500
Digital video customers 2,588,600 2,588,200
Digital percentage of analog video customers 42% 41%
Digital set-top terminals deployed 3,634,500 3,661,700
Non-Video Services:
High-Speed Data Services:
Estimated high-speed data homes passed 10,321,100 9,509,500
Residential high-speed data customers 1,527,800 1,099,000
Estimated penetration of high-speed data homes passed 15% 12%
Telephony customers 24,900 22,800
05.
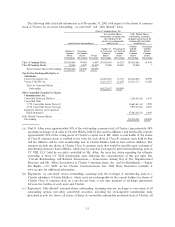
(a) Pro forma results reflect the sales of certain cable systems to Atlantic Broadband Finance, LLC, which closed in March and April 2004, and WaveDivision Holdings, LLC which closed in October 2003, as if they had occurred
as of December 31, 2002. As of December 31, 2003, the systems sold in these transactions served approximately 254,000 analog video customers. See the customer statistics table in the “Our Business” section for
customer statistics reported on an actual basis and additional information related to such statistics.
(b) “Customers” include all persons our corporate billing records show as receiving service (regardless of their payment status), except for complimentary accounts (such as our employees). Further, “customers” include
persons receiving service under promotional programs that offered up to two months of service for free, some of whom had not requested to be disconnected on or before December 31, 2003, but had not become paying
customers as of that date.