Charter 2003 Annual Report Download - page 53
Download and view the complete annual report
Please find page 53 of the 2003 Charter annual report below. You can navigate through the pages in the report by either clicking on the pages listed below, or by using the keyword search tool below to find specific information within the annual report.-
 1
1 -
2
-
3
-
4
-
5
-
6
-
7
-
8
-
9
-
10
-
11
-
12
-
13
-
14
-
15
-
16
-
17
-
18
-
19
-
20
-
21
-
22
-
23
-
24
-
25
-
26
-
27
-
28
-
29
-
30
-
31
-
32
-
33
-
34
-
35
-
36
-
37
-
38
-
39
-
40
-
41
-
42
-
 43
43 -
 44
44 -
 45
45 -
 46
46 -
 47
47 -
 48
48 -
 49
49 -
 50
50 -
 51
51 -
 52
52 -
 53
53 -
 54
54 -
 55
55 -
 56
56 -
 57
57 -
 58
58 -
 59
59 -
 60
60 -
 61
61 -
 62
62 -
 63
63 -
64
-
65
-
66
-
67
-
68
-
69
-
70
-
71
-
72
-
73
-
74
-
75
-
76
-
77
-
78
-
79
-
80
-
81
-
82
-
83
-
84
-
85
-
86
-
87
-
88
-
89
-
90
-
91
-
92
-
93
-
94
-
95
-
96
-
97
-
98
-
99
-
100
-
101
-
102
-
103
-
104
-
105
-
106
-
107
-
108
-
109
-
110
-
111
-
112
-
113
-
114
-
115
-
116
-
117
-
118
-
119
-
120
-
121
-
122
-
123
-
124
-
125
-
126
-
127
-
128
-
129
-
130
-
131
-
132
-
133
-
134
-
135
-
136
-
137
-
138
-
139
-
140
-
141
-
142
-
143
-
144
-
145
-
146
-
147
-
148
-
149
-
150
-
151
-
152
-
153
 |
 |

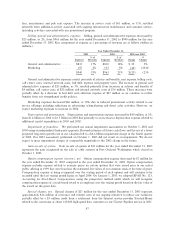
Operating expenses. Operating expenses increased $321 million, or 22%, from $1.5 billion in 2001 to
$1.8 billion in 2002. Programming costs included in the accompanying consolidated statements of operations
were $1.2 billion and $963 million, representing 65% of total operating expenses for the years ended
December 31, 2002 and 2001, respectively. Key expense components as a percentage of revenues are as
follows (dollars in millions):
Year Ended December 31,
2002 2001 2002 over 2001
% of % of %
Expenses Revenues Expenses Revenues Change Change
Programming ÏÏÏÏÏÏÏÏÏÏÏÏÏÏÏÏÏÏÏ $1,166 26% $ 963 25% $203 21%
Advertising sales ÏÏÏÏÏÏÏÏÏÏÏÏÏÏÏÏ 87 2% 64 2% 23 36%
Service ÏÏÏÏÏÏÏÏÏÏÏÏÏÏÏÏÏÏÏÏÏÏÏÏ 554 12% 459 12% 95 21%
$1,807 40% $1,486 39% $321 22%
Programming costs consist primarily of costs paid to programmers for the provision of analog, premium
and digital channels and pay-per-view programs. The increase in programming costs of $203 million, or 21%,
was primarily due to price increases, particularly in sports programming, an increased number of channels
carried on our systems and an increase in digital video customers. In addition, approximately $51 million of
the increase results from a full year of costs related to the acquisition of AT&T Broadband systems in June
2001. Programming costs were oÅset by the amortization of payments received from programmers in support
of launches of new channels against programming costs of $57 million and $35 million for the years ended
December 31, 2002 and 2001, respectively.
Advertising sales expenses consist of costs related to traditional advertising services provided to
advertising customers, including salaries and beneÑts and commissions. Advertising sales expenses increased
$23 million, or 36%, primarily due to increased sales commissions resulting from the increase in advertising
revenues. Service costs consist primarily of service personnel salaries and beneÑts, franchise fees, system
utilities, Internet service provider fees, maintenance and pole rent expense. The increase in service costs of
$95 million, or 21%, resulted primarily from our growth in digital video and high-speed data services.
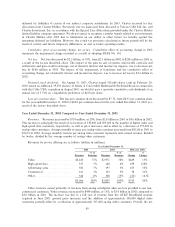
Selling, general and administrative expenses. Selling, general and administrative expenses increased by
$137 million, or 17%, from $826 million for the year ended December 31, 2001 to $963 million for the year
ended December 31, 2002. Key components of expense as a percentage of revenues are as follows (dollars in
millions):
Year Ended December 31,
2002 2001 2002 over 2001
% of % of %
Expenses Revenues Expenses Revenues Change Change
General and administrative ÏÏÏÏÏÏÏ $810 18% $689 18% $121 18%
MarketingÏÏÏÏÏÏÏÏÏÏÏÏÏÏÏÏÏÏÏÏÏÏ 153 3% 137 4% 16 12%
$963 21% $826 22% $137 17%
General and administrative expenses consist primarily of salaries and beneÑts, rent expense, billing costs,
call center costs, internal network costs, bad debt expense and property taxes. The increase in general and
administrative expenses of $121 million, or 18%, resulted primarily from increases in salaries and beneÑts of
$66 million, bad debt and collection expense of $24 million and insurance of $13 million. The increase in bad
debt expense resulted primarily from continuing eÅects of our aggressive discounting of our analog video
service during late 2000 and most of 2001 in an eÅort to grow our customer base and respond to price
competition from satellite providers. This practice led to an increase in customers during the discounted period
whose service was subsequently disconnected for non-payment or who subsequently cancelled their service
without payment for services provided. We also lengthened the period during which we extended credit to
customers, which increased exposure to customers whose accounts were subject to cancellation and increased
51