Charter 2010 Annual Report Download - page 110
Download and view the complete annual report
Please find page 110 of the 2010 Charter annual report below. You can navigate through the pages in the report by either clicking on the pages listed below, or by using the keyword search tool below to find specific information within the annual report.-
 1
1 -
2
-
3
-
4
-
5
-
6
-
7
-
8
-
9
-
10
-
11
-
12
-
13
-
14
-
15
-
16
-
17
-
18
-
19
-
20
-
21
-
22
-
23
-
24
-
25
-
26
-
27
-
28
-
29
-
30
-
31
-
32
-
33
-
34
-
35
-
36
-
37
-
38
-
39
-
40
-
41
-
42
-
43
-
44
-
45
-
46
-
47
-
48
-
49
-
50
-
51
-
52
-
53
-
54
-
55
-
56
-
57
-
58
-
59
-
60
-
61
-
62
-
63
-
64
-
65
-
66
-
67
-
68
-
69
-
70
-
71
-
72
-
73
-
74
-
75
-
76
-
77
-
78
-
79
-
80
-
81
-
82
-
83
-
84
-
85
-
86
-
87
-
88
-
89
-
90
-
91
-
92
-
93
-
94
-
95
-
96
-
97
-
98
-
99
-
 100
100 -
 101
101 -
 102
102 -
 103
103 -
 104
104 -
 105
105 -
 106
106 -
 107
107 -
 108
108 -
 109
109 -
 110
110 -
 111
111 -
 112
112 -
 113
113 -
 114
114 -
 115
115 -
 116
116 -
 117
117 -
 118
118 -
 119
119 -
 120
120 -
121
-
122
-
123
-
124
-
125
-
126
-
127
-
128
-
129
-
130
-
131
-
132
-
133
-
134
-
135
-
136
-
137
-
138
-
139
-
140
-
141
-
142
-
143
 |
 |

F- F-PB
CHARTER COMMUNICATIONS, INC. AND SUBSIDIARIES NOTES TO CONSOLIDATED FINANCIAL STATEMENTS DECEMBER 31, 2010, 2009, AND 2008
(dollars in millions, except share or per share data or where indicated)
Level 1 – inputs to the valuation methodology are quoted prices (unadjusted) for identical assets or liabilities in active markets.
Level 2 – inputs to the valuation methodology include quoted prices for similar assets and liabilities in active markets, and inputs that are
observable for the asset or liability, either directly or indirectly, for substantially the full term of the financial instrument.
Level 3 – inputs to the valuation methodology are unobservable and significant to the fair value measurement.
e interest rate derivatives designated as hedges were valued at December 31, 2010 using a present value calculation based on an implied
forward LIBOR curve (adjusted for Charter Operating’s or counterparties’ credit risk) and were classified within Level 2 of the valuation
hierarchy. e weighted average pay rate for the Company’s interest rate swap agreements was 2.25% at December 31, 2010 (exclusive of
applicable spreads).
e Preferred Stock was valued at December 31, 2009 using an income approach based on yields of the Company’s debt securities and was
classified within Level 3 of the valuation hierarchy. On April 16, 2010, Charter redeemed all of the shares of the Preferred Stock.
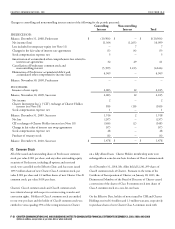
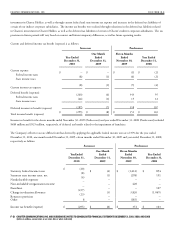
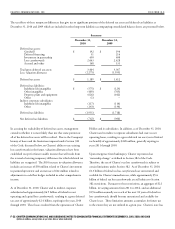
At December 31, 2010 and 2009, the Company’s financial liabilities that were accounted for at fair value on a recurring basis are presented in
the table below:
Fair Value As of December 31, 2010 Fair Value As of December 31, 2009
Level 1 Level 2 Level 3 Total Level 1 Level 2 Level 3 Total
Other long-term liabilities:
Preferred stock $ -- $ -- $ -- $ -- $ -- $ -- $ 148 $ 148
Interest rate derivatives
designated as hedges -- 57 -- 57 -- -- -- --
$ -- $57 $ -- $ 57 $ -- $ -- $ 148 $ 148
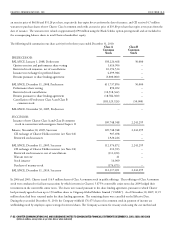
e Company’s long-term debt was adjusted to fair value on the Effective Date. Debt instruments with a fair value of $9.8 billion were
classified as Level 1 within the fair value hierarchy and debt instruments with a fair value of $3.5 billion were classified as Level 2 in the fair
value hierarchy on the Effective Date.
Nonfinancial Assets and Liabilities
e Company adopted new accounting guidance effective January 1, 2009 with respect to its nonfinancial assets and liabilities including fair
value measurements of franchises, property, plant, and equipment, and other intangible assets. ese assets are not measured at fair value on a
recurring basis; however they are subject to fair value adjustments in certain circumstances, such as when there is evidence that an impairment
may exist. During 2009, the Company recorded an impairment on its franchise assets of $2.2 billion and reflected its franchises, property,
plant and equipment, customer relationships and goodwill at fair value based on applying fresh start accounting. e fair value of these assets
was determined utilizing an income approach or cost approach that makes use of significant unobservable inputs. Such fair values are classified
as level 3 in the fair value hierarchy. See Note 5 for additional information.
•
•
•