Charter 2010 Annual Report Download - page 132
Download and view the complete annual report
Please find page 132 of the 2010 Charter annual report below. You can navigate through the pages in the report by either clicking on the pages listed below, or by using the keyword search tool below to find specific information within the annual report.-
 1
1 -
2
-
3
-
4
-
5
-
6
-
7
-
8
-
9
-
10
-
11
-
12
-
13
-
14
-
15
-
16
-
17
-
18
-
19
-
20
-
21
-
22
-
23
-
24
-
25
-
26
-
27
-
28
-
29
-
30
-
31
-
32
-
33
-
34
-
35
-
36
-
37
-
38
-
39
-
40
-
41
-
42
-
43
-
44
-
45
-
46
-
47
-
48
-
49
-
50
-
51
-
52
-
53
-
54
-
55
-
56
-
57
-
58
-
59
-
60
-
61
-
62
-
63
-
64
-
65
-
66
-
67
-
68
-
69
-
70
-
71
-
72
-
73
-
74
-
75
-
76
-
77
-
78
-
79
-
80
-
81
-
82
-
83
-
84
-
85
-
86
-
87
-
88
-
89
-
90
-
91
-
92
-
93
-
94
-
95
-
96
-
97
-
98
-
99
-
100
-
101
-
102
-
103
-
104
-
105
-
106
-
107
-
108
-
109
-
110
-
111
-
112
-
113
-
114
-
115
-
116
-
117
-
118
-
119
-
120
-
121
-
 122
122 -
 123
123 -
 124
124 -
 125
125 -
 126
126 -
 127
127 -
 128
128 -
 129
129 -
 130
130 -
 131
131 -
 132
132 -
 133
133 -
 134
134 -
 135
135 -
 136
136 -
 137
137 -
 138
138 -
 139
139 -
 140
140 -
 141
141 -
 142
142 -
143
 |
 |

F- F-PB
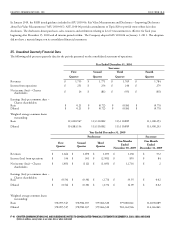
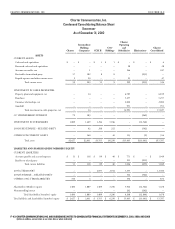
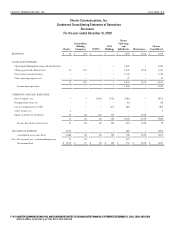
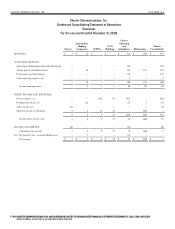
CHARTER COMMUNICATIONS, INC. AND SUBSIDIARIES NOTES TO CONSOLIDATED FINANCIAL STATEMENTS DECEMBER 31, 2010, 2009, AND 2008
(dollars in millions, except share or per share data or where indicated)
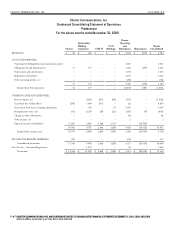
Charter
Intermediate
Holding
Companies CCH II
CCO
Holdings
Charter
Operating
and
Subsidiaries Eliminations
Charter
Consolidated
REVENUES $ 29 $ 306 $ -- $ -- $ 6,183 $ (335) $ 6,183
COSTS AND EXPENSES:
Operating (excluding depreciation and amortization) -- -- -- -- 2,663 -- 2,663
Selling, general and administrative 17 133 -- -- 1,264 (150) 1,264
Depreciation and amortization -- -- -- -- 1,194 -- 1,194
Impairment of franchises -- -- -- -- 2,163 -- 2,163
Other operating income, net -- -- -- -- (38) -- (38)
17 133 -- -- 7,246 (150) 7,246
Income (loss) from operations 12 173 -- -- (1,063) (185) (1,063)
OTHER INCOME AND (EXPENSES):
Interest expense, net -- (204) (233) (68) (515) -- (1,020)
Gain (loss) due to Plan effects (229) 7,400 (351) -- (2) -- 6,818
Gain due to fresh start accounting adjustments -- 158 -- 25 5,476 -- 5,659
Reorganization items, net (12) (229) (38) (22) (528) 185 (644)
Change in value of derivatives -- -- -- -- (4) -- (4)
Other income, net -- -- -- -- 2 -- 2
Equity in income of subsidiaries 11,203 2,666 3,288 3,353 -- (20,510) --
10,962 9,791 2,666 3,288 4,429 (20,325) 10,811
Income before income taxes 10,974 9,964 2,666 3,288 3,366 (20,510) 9,748
INCOME TAX BENEFIT (EXPENSE) 390 -- -- -- (39) -- 351
Consolidated net income 11,364 9,964 2,666 3,288 3,327 (20,510) 10,099
Less: Net loss – noncontrolling interest -- 1,239 -- -- 26 -- 1,265
Net income $ 11,364 $ 11,203 $ 2,666 $ 3,288 $ 3,353 $ (20,510) $ 11,364