Charter 2010 Annual Report Download - page 59
Download and view the complete annual report
Please find page 59 of the 2010 Charter annual report below. You can navigate through the pages in the report by either clicking on the pages listed below, or by using the keyword search tool below to find specific information within the annual report.-
 1
1 -
2
-
3
-
4
-
5
-
6
-
7
-
8
-
9
-
10
-
11
-
12
-
13
-
14
-
15
-
16
-
17
-
18
-
19
-
20
-
21
-
22
-
23
-
24
-
25
-
26
-
27
-
28
-
29
-
30
-
31
-
32
-
33
-
34
-
35
-
36
-
37
-
38
-
39
-
40
-
41
-
42
-
43
-
44
-
45
-
46
-
47
-
48
-
 49
49 -
 50
50 -
 51
51 -
 52
52 -
 53
53 -
 54
54 -
 55
55 -
 56
56 -
 57
57 -
 58
58 -
 59
59 -
 60
60 -
 61
61 -
 62
62 -
 63
63 -
 64
64 -
 65
65 -
 66
66 -
 67
67 -
 68
68 -
 69
69 -
70
-
71
-
72
-
73
-
74
-
75
-
76
-
77
-
78
-
79
-
80
-
81
-
82
-
83
-
84
-
85
-
86
-
87
-
88
-
89
-
90
-
91
-
92
-
93
-
94
-
95
-
96
-
97
-
98
-
99
-
100
-
101
-
102
-
103
-
104
-
105
-
106
-
107
-
108
-
109
-
110
-
111
-
112
-
113
-
114
-
115
-
116
-
117
-
118
-
119
-
120
-
121
-
122
-
123
-
124
-
125
-
126
-
127
-
128
-
129
-
130
-
131
-
132
-
133
-
134
-
135
-
136
-
137
-
138
-
139
-
140
-
141
-
142
-
143
 |
 |

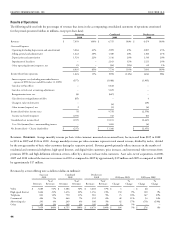
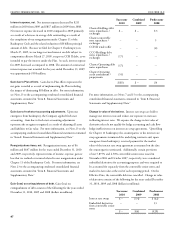
Operating expenses. e increases in our operating expenses are
attributable to the following (dollars in millions):
2010 compared
to 2009
2009 compared
to 2008
Programming costs $82 $96
Labor costs 38 26
Franchise and
regulatory fees 16 10
Commercial services 10 (1)
Vehicle costs 6 ( 12)
Ad sales 6 ( 10)
Other, net 5 __
Asset sales, net
of acquisitions (8) (7)
$155 $102
Programming costs were approximately $1.8 billion, $1.7 billion
and $1.6 billion, representing 59%, 60% and 59% of total operating
expenses for the years ended December 31, 2010, 2009 and 2008,
respectively. Programming costs consist primarily of costs paid to
programmers for basic, premium, digital, OnDemand, and pay-
per-view programming. e increases in programming costs are
primarily a result of annual contractual rate adjustments, offset in
part by asset sales and customer losses. Programming costs were also
offset by the amortization of payments received from programmers
of $17 million, $26 million and $33 million in 2010, 2009 and
2008, respectively. We expect programming expenses to continue to
increase, and at a higher rate than in 2010, due to a variety of factors,
including amounts paid for retransmission consent, annual increases
imposed by programmers, and additional programming, including
high-definition, OnDemand, and pay-per-view programming, being
provided to our customers.
Service labor increased as a result of increases in service calls resulting
from our strategic bandwidth initiatives and commercial services
expenses increased as a result of growth in our commercial business.
Our strategic bandwidth initiatives will continue in 2011 and while
our service labor expenses stabilized in the fourth quarter of 2010,
there can be no assurance that they will not increase in 2011.
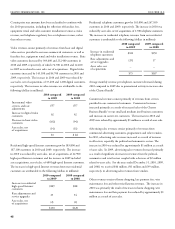
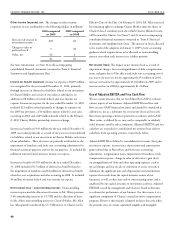
Selling, general and administrative expenses. e increases
(decreases) in selling, general and administrative expenses are
attributable to the following (dollars in millions):
2010 compared
to 2009
2009 compared
to 2008
Commercial services $22 $7
Marketing costs 15 5
Bad debt and
collection costs 3 9
Customer care 3 ( 4)
Employee costs 2 ( 7)
Stock compensation ( 1) ( 6)
Other, net 3 ( 6)
Asset sales, net
of acquisitions ( 5) (4)
$42 $ (6)
Depreciation and amortization. Depreciation and amortization
expense increased by $208 million and $6 million in 2010 and 2009,
respectively. e increases were primarily the result of increased
amortization associated with the increase in customer relationships as
a part of applying fresh start accounting offset by asset sales.
Impairment of franchises. We recorded impairment of $2.2 billion
and $1.5 billion for the years ended December 31, 2009 and 2008,
respectively. e impairments recorded in 2009 and 2008 were a
result of the continued economic pressure on our customers from
the economic downturn along with increased competition and the
related impact to our projected future growth rates. e valuation
completed in 2010 showed franchise values in excess of book value,
and thus resulted in no impairment.
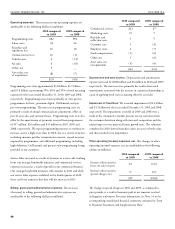
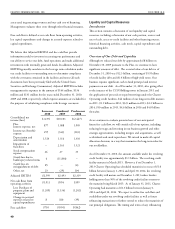
Other operating (income) expenses, net. e changes in other
operating (income) expenses, net are attributable to the following
(dollars in millions):
2010 compared
to 2009
2009 compared
to 2008
Increases (decreases) in
losses on sales of assets $2 $ (6)
Increases (decreases) in
special charges, net 57 (97)
$59 $(103)
e change in special charges in 2010 and 2009, as compared to
prior periods, is a result of amounts paid or net amounts received
in litigation settlements. For more information, see Note 14 to the
accompanying consolidated financial statements contained in “Item
8. Financial Statements and Supplementary Data.”