Charter 2010 Annual Report Download - page 66
Download and view the complete annual report
Please find page 66 of the 2010 Charter annual report below. You can navigate through the pages in the report by either clicking on the pages listed below, or by using the keyword search tool below to find specific information within the annual report.-
 1
1 -
2
-
3
-
4
-
5
-
6
-
7
-
8
-
9
-
10
-
11
-
12
-
13
-
14
-
15
-
16
-
17
-
18
-
19
-
20
-
21
-
22
-
23
-
24
-
25
-
26
-
27
-
28
-
29
-
30
-
31
-
32
-
33
-
34
-
35
-
36
-
37
-
38
-
39
-
40
-
41
-
42
-
43
-
44
-
45
-
46
-
47
-
48
-
49
-
50
-
51
-
52
-
53
-
54
-
55
-
 56
56 -
 57
57 -
 58
58 -
 59
59 -
 60
60 -
 61
61 -
 62
62 -
 63
63 -
 64
64 -
 65
65 -
 66
66 -
 67
67 -
 68
68 -
 69
69 -
 70
70 -
 71
71 -
 72
72 -
 73
73 -
 74
74 -
 75
75 -
 76
76 -
77
-
78
-
79
-
80
-
81
-
82
-
83
-
84
-
85
-
86
-
87
-
88
-
89
-
90
-
91
-
92
-
93
-
94
-
95
-
96
-
97
-
98
-
99
-
100
-
101
-
102
-
103
-
104
-
105
-
106
-
107
-
108
-
109
-
110
-
111
-
112
-
113
-
114
-
115
-
116
-
117
-
118
-
119
-
120
-
121
-
122
-
123
-
124
-
125
-
126
-
127
-
128
-
129
-
130
-
131
-
132
-
133
-
134
-
135
-
136
-
137
-
138
-
139
-
140
-
141
-
142
-
143
 |
 |

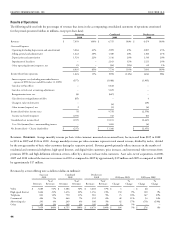
Financing Activities. Net cash used in financing activities was $1.5
billion for the year ended December 31, 2010, and net cash provided
by financing activities was $504 million and $1.7 billion for the years
ended December 31, 2009 and 2008, respectively. e increase in cash
used during the year ended December 31, 2010 compared to the
corresponding period in 2009 was primarily due to increased repayments
of long-term debt and repayment of preferred stock, offset by borrowings
of long-term debt. e decrease in cash provided during the year ended
December 31, 2009 compared the corresponding period in 2008 was
primarily the result of no borrowings of long-term debt in 2009.
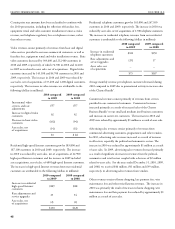
Capital Expenditures
We have significant ongoing capital expenditure requirements.
Capital expenditures were $1.2 billion, $1.1 billion and $1.2 billion
for the years ended December 31, 2010, 2009 and 2008, respectively,
and increased as a result of strategic investments including DOCSIS
3.0, bandwidth reclamation projects such as switch-digital video
launches and investments made to move into new commercial
segments. We expect these expenditures to continue to increase in
2011. See the table below for more details.
Our capital expenditures are funded primarily from free cash flow
and borrowings on our credit facility. In addition, our liabilities
related to capital expenditures increased by $8 million for the
year ended December 31, 2010 and decreased by $10 million and
$39 million for the years ended December 31, 2009 and 2008,
respectively.
During 2011, we expect capital expenditures to be between $1.3
billion and $1.4 billion. We expect the nature of these expenditures
will continue to be composed primarily of purchases of customer
premise equipment related to advanced video services, scalable
infrastructure and support capital. e actual amount of our capital
expenditures depends in part on the deployment of advanced video
services and offerings. Capital expenditures will increase if there is
accelerated growth in high-speed Internet, telephone, commercial
business or digital customers or there is an increased need to respond
to competitive pressures by expanding the delivery of other advanced
video services.
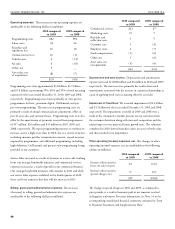
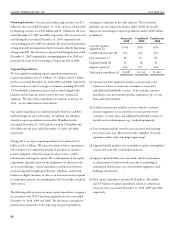
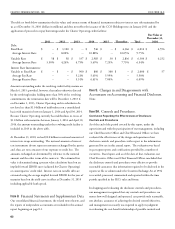
e following table presents our major capital expenditures categories
in accordance with NCTA disclosure guidelines for the years ended
December 31, 2010, 2009 and 2008. e disclosure is intended to
provide more consistency in the reporting of capital expenditures
among peer companies in the cable industry. ese disclosure
guidelines are not required disclosures under GAAP, nor do they
impact our accounting for capital expenditures under GAAP (dollars
in millions):
Successor
2010 Combined
2009 Predecessor
2008
Customer premise
equipment (a) $ 543 $593 $595
Scalable infrastructure (b) 311 216 251
Line extensions (c) 90 70 80
Upgrade/rebuild (d) 21 28 40
Support capital (e) 244 227 236
Total capital expenditures (f) $1,209 $1,134 $1,202
(a) Customer premise equipment includes costs incurred at the
customer residence to secure new customers, revenue units
and additional bandwidth revenues. It also includes customer
installation costs and customer premise equipment (e.g., set-top
boxes and cable modems).
(b) Scalable infrastructure includes costs not related to customer
premise equipment or our network, to secure growth of new
customers, revenue units, and additional bandwidth revenues, or
provide service enhancements (e.g., headend equipment).
(c) Line extensions include network costs associated with entering
new service areas (e.g., fiber/coaxial cable, amplifiers, electronic
equipment, make-ready and design engineering).
(d) Upgrade/rebuild includes costs to modify or replace existing fiber/
coaxial cable networks, including betterments.
(e) Support capital includes costs associated with the replacement
or enhancement of non-network assets due to technological
and physical obsolescence (e.g., non-network equipment, land,
buildings and vehicles).
(f) Total capital expenditures includes $138 million, $83 million
and $79 million of capital expenditures related to commercial
services for the years ended December 31, 2010, 2009 and 2008,
respectively.