Charter 2010 Annual Report Download - page 62
Download and view the complete annual report
Please find page 62 of the 2010 Charter annual report below. You can navigate through the pages in the report by either clicking on the pages listed below, or by using the keyword search tool below to find specific information within the annual report.-
 1
1 -
2
-
3
-
4
-
5
-
6
-
7
-
8
-
9
-
10
-
11
-
12
-
13
-
14
-
15
-
16
-
17
-
18
-
19
-
20
-
21
-
22
-
23
-
24
-
25
-
26
-
27
-
28
-
29
-
30
-
31
-
32
-
33
-
34
-
35
-
36
-
37
-
38
-
39
-
40
-
41
-
42
-
43
-
44
-
45
-
46
-
47
-
48
-
49
-
50
-
51
-
 52
52 -
 53
53 -
 54
54 -
 55
55 -
 56
56 -
 57
57 -
 58
58 -
 59
59 -
 60
60 -
 61
61 -
 62
62 -
 63
63 -
 64
64 -
 65
65 -
 66
66 -
 67
67 -
 68
68 -
 69
69 -
 70
70 -
 71
71 -
 72
72 -
73
-
74
-
75
-
76
-
77
-
78
-
79
-
80
-
81
-
82
-
83
-
84
-
85
-
86
-
87
-
88
-
89
-
90
-
91
-
92
-
93
-
94
-
95
-
96
-
97
-
98
-
99
-
100
-
101
-
102
-
103
-
104
-
105
-
106
-
107
-
108
-
109
-
110
-
111
-
112
-
113
-
114
-
115
-
116
-
117
-
118
-
119
-
120
-
121
-
122
-
123
-
124
-
125
-
126
-
127
-
128
-
129
-
130
-
131
-
132
-
133
-
134
-
135
-
136
-
137
-
138
-
139
-
140
-
141
-
142
-
143
 |
 |

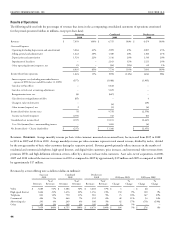
assets used in generating revenues and our cash cost of financing.
Management evaluates these costs through other financial measures.
Free cash flow is defined as net cash flows from operating activities,
less capital expenditures and changes in accrued expenses related to
capital expenditures.
We believe that Adjusted EBITDA and free cash flow provide
information useful to investors in assessing our performance and
our ability to service our debt, fund operations and make additional
investments with internally generated funds. In addition, Adjusted
EBITDA generally correlates to the leverage ratio calculation under
our credit facilities or outstanding notes to determine compliance
with the covenants contained in the facilities and notes (all such
documents have been previously filed with the United States
Securities and Exchange Commission). Adjusted EBITDA includes
management fee expenses in the amount of $144 million, $136
million and $131 million for the years ended December 31, 2010,
2009 and 2008, respectively, which expense amounts are excluded for
the purposes of calculating compliance with leverage covenants.
Successor
2010 Combined
2009 Predecessor
2008
Consolidated net
income (loss) $ (237) $10,101 $(2,447)
Plus:
Interest expense, net 877 1,088 1,905
Income tax (benefit)
expense 295 (343) (103)
Depreciation and
amortization 1,524 1,316 1,310
Impairment of
franchises -- 2,163 1,521
Stock compensation
expense 26 27 33
(Gain) loss due to
bankruptcy related items 6 (11,830) --
(Gain) loss on
extinguishment of debt 85 -- (4)
Other, net 23 (29) 104
Adjusted EBITDA $2,599 $2,493 $2,319
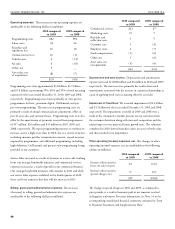
Net cash flows from
operating activities $1,911 $594 $399
Less: Purchases of
property, plant and
equipment (1,209) (1,134) (1,202)
Change in accrued
expenses related to
capital expenditures 8 (10) (39)
Free cash flow $710 $(550) $(842)
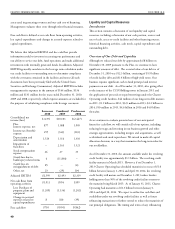
Introduction
is section contains a discussion of our liquidity and capital
resources, including a discussion of our cash position, sources and
uses of cash, access to credit facilities and other financing sources,
historical financing activities, cash needs, capital expenditures and
outstanding debt.
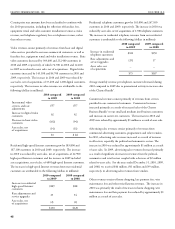
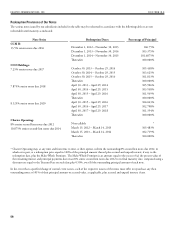
Overview of Our Debt and Liquidity
Although we reduced our debt by approximately $8 billion on
November 30, 2009 pursuant to the Plan, we continue to have
significant amounts of debt. e accreted value of our debt as of
December 31, 2010 was $12.3 billion, consisting of $5.9 billion
of credit facility debt and $6.4 billion of high-yield notes. Our
business requires significant cash to fund principal and interest
payments on our debt. As of December 31, 2010, after giving effect
to the issuance of the CCO Holdings notes in January 2011 and
the application of proceeds to repay borrowings under the Charter
Operating credit facilities, $44 million of our long-term debt matures
in 2011, $1.1 billion in 2012, $323 million in 2013, $2.2 billion in
2014, $30 million in 2015, $4.6 billion in 2016 and $4.0 billion
thereafter.
As we continue to evaluate potential uses of our anticipated
future free cash flow, we will consider all of our options, including
reducing leverage and investing in our business growth and other
strategic opportunities, including mergers and acquisitions, as well
as dividends and stock repurchases. We intend to make all capital
allocation decisions in a way that maximizes the long-term value for
our stockholders.
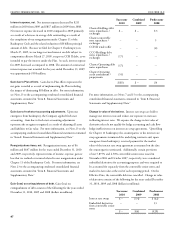
As of December 31, 2010, the amount available under the revolving
credit facility was approximately $1.1 billion. e revolving credit
facility matures in March 2015. However, if on December 1,
2013 Charter Operating has scheduled maturities in excess of $1.0
billion between January 1, 2014 and April 30, 2014, the revolving
credit facility will mature on December 1, 2013 unless lenders
holding more than 50% of the revolving credit facility consent to
the maturity being March 2015. As of January 31, 2011, Charter
Operating had maturities of $1.3 billion between January 1,
2014 and April 30, 2014. We expect to utilize free cash flow and
availability under our revolving credit facilities as well as future
refinancing transactions to further extend or reduce the maturities of
our principal obligations. e timing and terms of any refinancing