Charter 2010 Annual Report Download - page 136
Download and view the complete annual report
Please find page 136 of the 2010 Charter annual report below. You can navigate through the pages in the report by either clicking on the pages listed below, or by using the keyword search tool below to find specific information within the annual report.-
 1
1 -
2
-
3
-
4
-
5
-
6
-
7
-
8
-
9
-
10
-
11
-
12
-
13
-
14
-
15
-
16
-
17
-
18
-
19
-
20
-
21
-
22
-
23
-
24
-
25
-
26
-
27
-
28
-
29
-
30
-
31
-
32
-
33
-
34
-
35
-
36
-
37
-
38
-
39
-
40
-
41
-
42
-
43
-
44
-
45
-
46
-
47
-
48
-
49
-
50
-
51
-
52
-
53
-
54
-
55
-
56
-
57
-
58
-
59
-
60
-
61
-
62
-
63
-
64
-
65
-
66
-
67
-
68
-
69
-
70
-
71
-
72
-
73
-
74
-
75
-
76
-
77
-
78
-
79
-
80
-
81
-
82
-
83
-
84
-
85
-
86
-
87
-
88
-
89
-
90
-
91
-
92
-
93
-
94
-
95
-
96
-
97
-
98
-
99
-
100
-
101
-
102
-
103
-
104
-
105
-
106
-
107
-
108
-
109
-
110
-
111
-
112
-
113
-
114
-
115
-
116
-
117
-
118
-
119
-
120
-
121
-
122
-
123
-
124
-
125
-
 126
126 -
 127
127 -
 128
128 -
 129
129 -
 130
130 -
 131
131 -
 132
132 -
 133
133 -
 134
134 -
 135
135 -
 136
136 -
 137
137 -
 138
138 -
 139
139 -
 140
140 -
 141
141 -
 142
142 -
 143
143
 |
 |

F- F-PB
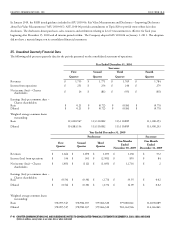
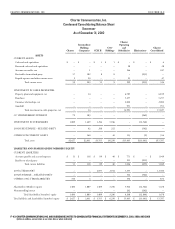
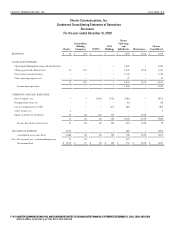
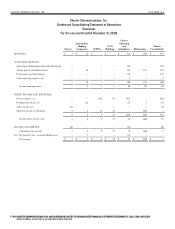
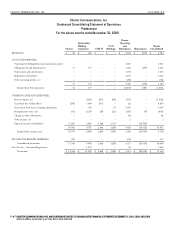
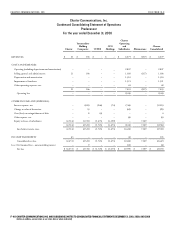
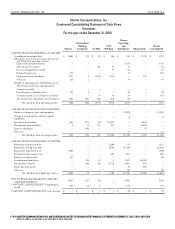
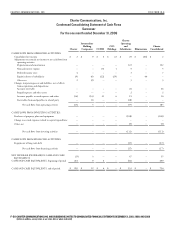
CHARTER COMMUNICATIONS, INC. AND SUBSIDIARIES NOTES TO CONSOLIDATED FINANCIAL STATEMENTS DECEMBER 31, 2010, 2009, AND 2008
(dollars in millions, except share or per share data or where indicated)
Charter
Intermediate
Holding
Companies CCH II
CCO
Holdings
Charter
Operating
and
Subsidiaries Eliminations
Charter
Consolidated
CASH FLOWS FROM OPERATING ACTIVITIES:
Consolidated net income $ 11,364 $ 9,964 $ 2,666 $ 3,288 $ 3,327 $ (20,510) $ 10,099
Adjustments to reconcile net income to net cash flows from
operating activities:
Depreciation and amortization -- -- -- -- 1,194 -- 1,194
Impairment of franchises -- -- -- -- 2,163 -- 2,163
Noncash interest expense -- 11 9 2 20 -- 42
Change in value of derivatives -- -- -- -- 4 -- 4
(Gain) loss due to effects of Plan 229 (7,400) 351 -- 2 -- (6,818)
Gain due to fresh start accounting adjustments -- (158) -- (25) (5,476) -- (5,659)
Noncash reorganization items, net -- 56 (8) -- 122 -- 170
Deferred income taxes (390) -- -- -- 32 -- (358)
Equity in income of subsidiaries (11,203) (2,666) (3,288) (3,353) -- 20,510 --
Other, net -- (1) -- 1 31 -- 31
Changes in operating assets and liabilities, net of effects from
acquisitions and dispositions:
Accounts receivable -- -- -- -- (52) -- (52)
Prepaid expenses and other assets -- (12) -- -- (24) -- (36)
Accounts payable, accrued expenses and other (18) 195 279 (6) (658) (136) (344)
Receivables from and payables to related party, including
deferred management fees -- 14 (8) (10) (21) -- (25)
Net cash flows from operating activities (18) 3 1 (103) 664 (136) 411
CASH FLOWS FROM INVESTING ACTIVITIES:
Purchases of property, plant and equipment -- -- -- -- (1,026) -- (1,026)
Change in accrued expenses related to capital expenditures -- -- -- -- (10) -- (10)
Purchase of CC VIII interest (150) -- -- -- -- -- (150)
Purchase of CCH II notes and accrued interest (1,112) -- -- -- -- 1,112 --
Investment in subsidiaries (71) (255) (51) (25) -- 402 --
Payments from subsidiaries 19 -- -- 75 -- (94) --
Other, net -- -- -- -- (7) -- (7)
Net cash flows from investing activities (1,314) (255) (51) 50 (1,043) 1,420 (1,193)
CASH FLOWS FROM FINANCING ACTIVITIES:
Proceeds from Rights Offering 1,614 -- -- -- -- -- 1,614
Repayments of long-term debt (25) -- -- -- (53) (976) (1,054)
Repayments to parent companies -- (19) -- -- (75) 94 --
Payments for debt issuance costs (39) -- -- -- -- -- (39)
Contributions from parent -- 275 51 51 25 (402) --
Other, net -- (2) -- -- 2 -- --
Net cash flows from financing activities 1,550 254 51 51 (101) (1,284) 521
NET INCREASE (DECREASE) IN CASH AND CASH
EQUIVALENTS 218 2 1 (2) (480) -- (261)
CASH AND CASH EQUIVALENTS, beginning of period -- 7 5 2 946 -- 960
CASH AND CASH EQUIVALENTS, end of period $ 218 $ 9 $ 6 $ -- $ 466 $ -- $ 699