Charter 2010 Annual Report Download - page 99
Download and view the complete annual report
Please find page 99 of the 2010 Charter annual report below. You can navigate through the pages in the report by either clicking on the pages listed below, or by using the keyword search tool below to find specific information within the annual report.-
 1
1 -
2
-
3
-
4
-
5
-
6
-
7
-
8
-
9
-
10
-
11
-
12
-
13
-
14
-
15
-
16
-
17
-
18
-
19
-
20
-
21
-
22
-
23
-
24
-
25
-
26
-
27
-
28
-
29
-
30
-
31
-
32
-
33
-
34
-
35
-
36
-
37
-
38
-
39
-
40
-
41
-
42
-
43
-
44
-
45
-
46
-
47
-
48
-
49
-
50
-
51
-
52
-
53
-
54
-
55
-
56
-
57
-
58
-
59
-
60
-
61
-
62
-
63
-
64
-
65
-
66
-
67
-
68
-
69
-
70
-
71
-
72
-
73
-
74
-
75
-
76
-
77
-
78
-
79
-
80
-
81
-
82
-
83
-
84
-
85
-
86
-
87
-
88
-
 89
89 -
 90
90 -
 91
91 -
 92
92 -
 93
93 -
 94
94 -
 95
95 -
 96
96 -
 97
97 -
 98
98 -
 99
99 -
 100
100 -
 101
101 -
 102
102 -
 103
103 -
 104
104 -
 105
105 -
 106
106 -
 107
107 -
 108
108 -
 109
109 -
110
-
111
-
112
-
113
-
114
-
115
-
116
-
117
-
118
-
119
-
120
-
121
-
122
-
123
-
124
-
125
-
126
-
127
-
128
-
129
-
130
-
131
-
132
-
133
-
134
-
135
-
136
-
137
-
138
-
139
-
140
-
141
-
142
-
143
 |
 |

F- F-PB
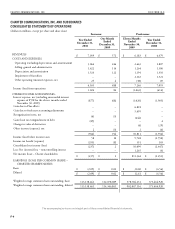
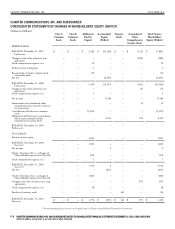
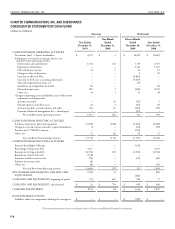
CHARTER COMMUNICATIONS, INC. AND SUBSIDIARIES NOTES TO CONSOLIDATED FINANCIAL STATEMENTS DECEMBER 31, 2010, 2009, AND 2008
(dollars in millions, except share or per share data or where indicated)
e fair value of trademarks was determined using the relief-from-royalty method which applies a fair royalty rate to estimated revenue.
Royalty rates are estimated based on a review of market royalty rates in the communications and entertainment industries. As the
Company expects to continue to use each trademark indefinitely, trademarks have been assigned an indefinite life and are tested annually for
impairment, or more frequently as warranted by events or changes in circumstances. e Company’s 2010 impairment analyses did not result
in any trademark impairment charges.
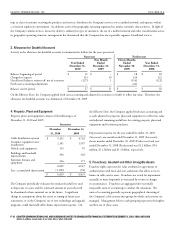
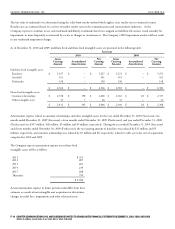
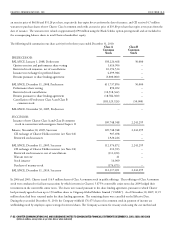
As of December 31, 2010 and 2009, indefinite lived and finite-lived intangible assets are presented in the following table:
Successor
2010 2009
Gross Net Gross Net
Carrying Accumulated Carrying Carrying Accumulated Carrying
Amount Amortization Amount Amount Amortization Amount
Indefinite lived intangible assets:
Franchises $ 5,257 $ -- $ 5,257 $ 5,272 $ -- $ 5,272
Goodwill 951 -- 951 951 -- 951
Trademarks 158 -- 158 158 158
$ 6,366 $ -- $ 6,366 $ 6,381 $ -- $ 6,381
Finite-lived intangible assets:
Customer relationships $ 2,358 $ 358 $ 2,000 $ 2,363 $ 28 $ 2,335
Other intangible assets 53 7 46 33 -- 33
$ 2,411 $ 365 $ 2,046 $ 2,396 $ 28 $ 2,368
Amortization expense related to customer relationships and other intangible assets for the year ended December 31, 2010 (Successor), one
month ended December 31, 2009 (Successor), eleven months ended November 30, 2009 (Predecessor), and year ended December 31, 2008
(Predecessor) was $337 million, $28 million, $5 million and $5 million, respectively. During the year ended December 31, 2010 (Successor)
and eleven months ended November 30, 2009 (Predecessor), the net carrying amount of franchises was reduced by $15 million and $9
million, respectively, and customer relationships was reduced by $5 million and $0, respectively, related to cable asset sales, net of acquisitions
completed in 2010 and 2009.
e Company expects amortization expense on its finite-lived
intangible assets will be as follows.
2011 $ 313
2012 287
2013 261
2014 234
2015 208
ereafter 743
$ 2,046
Actual amortization expense in future periods could differ from these
estimates as a result of new intangible asset acquisitions or divestitures,
changes in useful lives, impairments and other relevant factors.