Charter 2010 Annual Report Download - page 58
Download and view the complete annual report
Please find page 58 of the 2010 Charter annual report below. You can navigate through the pages in the report by either clicking on the pages listed below, or by using the keyword search tool below to find specific information within the annual report.-
 1
1 -
2
-
3
-
4
-
5
-
6
-
7
-
8
-
9
-
10
-
11
-
12
-
13
-
14
-
15
-
16
-
17
-
18
-
19
-
20
-
21
-
22
-
23
-
24
-
25
-
26
-
27
-
28
-
29
-
30
-
31
-
32
-
33
-
34
-
35
-
36
-
37
-
38
-
39
-
40
-
41
-
42
-
43
-
44
-
45
-
46
-
47
-
 48
48 -
 49
49 -
 50
50 -
 51
51 -
 52
52 -
 53
53 -
 54
54 -
 55
55 -
 56
56 -
 57
57 -
 58
58 -
 59
59 -
 60
60 -
 61
61 -
 62
62 -
 63
63 -
 64
64 -
 65
65 -
 66
66 -
 67
67 -
 68
68 -
69
-
70
-
71
-
72
-
73
-
74
-
75
-
76
-
77
-
78
-
79
-
80
-
81
-
82
-
83
-
84
-
85
-
86
-
87
-
88
-
89
-
90
-
91
-
92
-
93
-
94
-
95
-
96
-
97
-
98
-
99
-
100
-
101
-
102
-
103
-
104
-
105
-
106
-
107
-
108
-
109
-
110
-
111
-
112
-
113
-
114
-
115
-
116
-
117
-
118
-
119
-
120
-
121
-
122
-
123
-
124
-
125
-
126
-
127
-
128
-
129
-
130
-
131
-
132
-
133
-
134
-
135
-
136
-
137
-
138
-
139
-
140
-
141
-
142
-
143
 |
 |

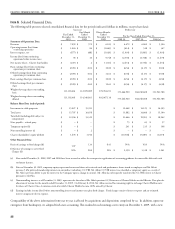
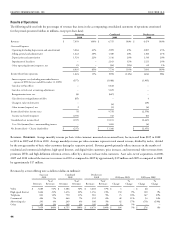
Certain prior year amounts have been reclassified to conform with
the 2010 presentation, including the reflection of franchise fees,
equipment rental and video customer installation revenue as video
revenue, and telephone regulatory fees as telephone revenue, rather
than other revenue.
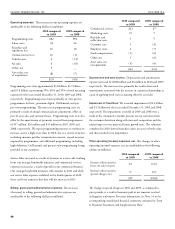
Video revenues consist primarily of revenues from basic and digital
video services provided to our non-commercial customers, as well as
franchise fees, equipment rental and video installation revenue. Basic
video customers decreased by 303,600 and 212,400 customers in
2010 and 2009, respectively, of which 76,700 in 2010 and 12,400
in 2009 were related to asset sales, net of acquisitions. Digital video
customers increased by 145,100 and 84,700 customers in 2010 and
2009, respectively. e increase in 2010 and 2009 was reduced by
asset sales, net of acquisitions, of 37,400 and 1,200 digital customers,
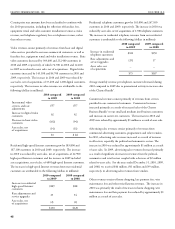
respectively. e increases in video revenues are attributable to the
following (dollars in millions):
2010 compared
to 2009
2009 compared
to 2008
Incremental video
services and rate
adjustments
$57 $57
Increase in digital video
customers 62 42
Decrease in basic video
customers (102) (94)
Asset sales, net
of acquisitions (14) (11)
$3 $ (6)
Residential high-speed Internet customers grew by 183,800 and
187,100 customers in 2010 and 2009, respectively. e increase
in 2010 was reduced by asset sales, net of acquisitions, of 22,900
high-speed Internet customers and the increase in 2009 included
asset acquisitions, net of sales, of 400 high-speed Internet customers.
e increases in high-speed Internet revenues from our residential
customers are attributable to the following (dollars in millions):
2010 compared
to 2009
2009 compared
to 2008
Increase in residential
high-speed Internet
customers
$109 $88
Rate adjustments and
service upgrades 23 34
Asset sales, net
of acquisitions (2) (2)
$130 $120
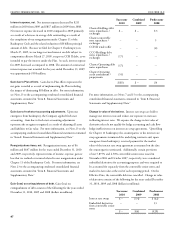
Residential telephone customers grew by 161,000 and 247,100
customers in 2010 and 2009, respectively. e increase in 2010 was
reduced by asset sales, net of acquisitions, of 1,700 telephone customers.
e increases in residential telephone revenues from our residential
customers is attributable to the following (dollars in millions):
2010 compared
to 2009
2009 compared
to 2008
Increase in residential
telephone customers $102 $150
Rate adjustments and
service upgrades (29) 17
Asset sales, net
of acquisitions -- --
$73 $167
Average monthly revenue per telephone customer decreased during
2010 compared to 2009 due to promotional activity to increase sales
of the Charter Bundle®.
Commercial revenues consist primarily of revenues from services
provided to our commercial customers. Commercial revenues
increased primarily as a result of increased sales of the Charter
Business Bundle® to our small and medium sized business customers
and increases in carrier site customers. e increases in 2010 and
2009 were reduced by approximately $1 million as a result of asset sales.
Advertising sales revenues consist primarily of revenues from
commercial advertising customers, programmers and other vendors.
In 2010, advertising sales revenues increased as a result of increases
in all sectors, especially the political and automotive sectors. e
increase in 2010 was reduced by approximately $1 million as a result
of asset sales. In 2009, advertising sales revenues decreased primarily
as a result of significant decreases in revenues from the political,
automotive and retail sectors coupled with a decrease of $2 million
related to asset sales. For the years ended December 31, 2010, 2009,
and 2008, we received $46 million, $41 million and $39 million,
respectively, in advertising sales revenues from vendors.
Other revenues consist of home shopping, late payment fees, wire
maintenance fees and other miscellaneous revenues. e increase in
2010 was primarily the result of increases in home shopping, wire
maintenance fees and late payment fees reduced by approximately $1
million as a result of asset sales.