Charter 2010 Annual Report Download - page 9
Download and view the complete annual report
Please find page 9 of the 2010 Charter annual report below. You can navigate through the pages in the report by either clicking on the pages listed below, or by using the keyword search tool below to find specific information within the annual report.-
 1
1 -
 2
2 -
 3
3 -
 4
4 -
 5
5 -
 6
6 -
 7
7 -
 8
8 -
 9
9 -
 10
10 -
 11
11 -
 12
12 -
 13
13 -
 14
14 -
 15
15 -
 16
16 -
 17
17 -
 18
18 -
 19
19 -
 20
20 -
21
-
22
-
23
-
24
-
25
-
26
-
27
-
28
-
29
-
30
-
31
-
32
-
33
-
34
-
35
-
36
-
37
-
38
-
39
-
40
-
41
-
42
-
43
-
44
-
45
-
46
-
47
-
48
-
49
-
50
-
51
-
52
-
53
-
54
-
55
-
56
-
57
-
58
-
59
-
60
-
61
-
62
-
63
-
64
-
65
-
66
-
67
-
68
-
69
-
70
-
71
-
72
-
73
-
74
-
75
-
76
-
77
-
78
-
79
-
80
-
81
-
82
-
83
-
84
-
85
-
86
-
87
-
88
-
89
-
90
-
91
-
92
-
93
-
94
-
95
-
96
-
97
-
98
-
99
-
100
-
101
-
102
-
103
-
104
-
105
-
106
-
107
-
108
-
109
-
110
-
111
-
112
-
113
-
114
-
115
-
116
-
117
-
118
-
119
-
120
-
121
-
122
-
123
-
124
-
125
-
126
-
127
-
128
-
129
-
130
-
131
-
132
-
133
-
134
-
135
-
136
-
137
-
138
-
139
-
140
-
141
-
142
-
143
 |
 |

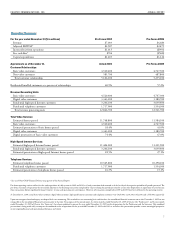
Operating Summary
For the year ended December ($ in millions) Pro Forma 00 Pro Forma 00
Revenue $7,003 $6,680
Adjusted EBITDA* $2,587 $2,475
Income (loss) from operations $1,015 ($993)
Free cash flow* $704 ($560)
Capital expenditures $1,203 $1,126
Approximate as of December , Actual 00 Pro Forma 00
Customer Relationships:
Basic video customers 4,520,400 4,747,300
Non-video customers 585,700 487,800
Total customer relationships 5,106,100 5,235,100
Residential bundled customers as a percent of relationships 60.9% 57.2%
Revenue Generating Units:
Basic video customers 4,520,400 4,747,300
Digital video customers 3,363,200 3,180,700
Residential high-speed Internet customers 3,246,100 3,039,400
Residential telephone customers 1,717,000 1,554,300
Total revenue generating units 12,846,700 12,521,700
Total Video Services:
Estimated homes passed 11,768,800 11,584,100
Basic video customers 4,520,400 4,747,300
Estimated penetration of basic homes passed 38.4% 41.0%
Digital video customers 3,363,200 3,180,700
Digital penetration of basic video customers 74.4% 67.0%
High-Speed Internet Services:
Estimated high-speed Internet homes passed 11,404,000 11,221,900
Residential high-speed Internet customers 3,246,100 3,039,400
Estimated penetration of high-speed Internet homes passed 28.5% 27.1%
Telephone Services:
Estimated telephone homes passed 10,565,800 10,298,100
Residential telephone customers 1,717,000 1,554,300
Estimated penetration of telephone homes passed 16.3% 15.1%
*See use of Non-GAAP Financial Metrics on page 126 of this Annual Report
Pro forma operating statistics reflect the sales and acquisitions of cable systems in 2009 and 2010 as if such transactions had occurred as of the last day of the respective period for all periods presented. e
pro forma statements of operations do not include adjustments for financing transactions completed by Charter during the periods presented or certain other dispositions or acquisitions of assets because
those transactions did not significantly impact Charter’s revenue and operating costs and expenses. However, all transactions completed in 2009 and 2010 have been reflected in the operating statistics.
At December 31, 2009, actual basic video customers, digital video customers, high-speed Internet customers and telephone customers were 4,824,000, 3,218,100, 3,062,300, and 1,556,000, respectively.
Upon our emergence from bankruptcy, we adopted fresh start accounting. is resulted in a new accounting basis and therefore, the consolidated financial statements on or after December 1, 2009 are not
comparable to the consolidated financial statements prior to that date. For purposes of this annual report, the eleven months ended November 30, 2009 of Charter (the “Predecessor”) and the one month
ended December 31, 2009 of Charter (the “Successor”) have been combined to present the year ended December 31, 2009 results of operations for the Predecessor and the Successor. is combined
presentation is being made solely to compare the combined results of operations for the year ended December 31, 2009 with 2010 as we believe this presentation provides a more meaningful perspective
on our ongoing financial and operational performance and trends.