Charter 2010 Annual Report Download - page 57
Download and view the complete annual report
Please find page 57 of the 2010 Charter annual report below. You can navigate through the pages in the report by either clicking on the pages listed below, or by using the keyword search tool below to find specific information within the annual report.-
 1
1 -
2
-
3
-
4
-
5
-
6
-
7
-
8
-
9
-
10
-
11
-
12
-
13
-
14
-
15
-
16
-
17
-
18
-
19
-
20
-
21
-
22
-
23
-
24
-
25
-
26
-
27
-
28
-
29
-
30
-
31
-
32
-
33
-
34
-
35
-
36
-
37
-
38
-
39
-
40
-
41
-
42
-
43
-
44
-
45
-
46
-
 47
47 -
 48
48 -
 49
49 -
 50
50 -
 51
51 -
 52
52 -
 53
53 -
 54
54 -
 55
55 -
 56
56 -
 57
57 -
 58
58 -
 59
59 -
 60
60 -
 61
61 -
 62
62 -
 63
63 -
 64
64 -
 65
65 -
 66
66 -
 67
67 -
68
-
69
-
70
-
71
-
72
-
73
-
74
-
75
-
76
-
77
-
78
-
79
-
80
-
81
-
82
-
83
-
84
-
85
-
86
-
87
-
88
-
89
-
90
-
91
-
92
-
93
-
94
-
95
-
96
-
97
-
98
-
99
-
100
-
101
-
102
-
103
-
104
-
105
-
106
-
107
-
108
-
109
-
110
-
111
-
112
-
113
-
114
-
115
-
116
-
117
-
118
-
119
-
120
-
121
-
122
-
123
-
124
-
125
-
126
-
127
-
128
-
129
-
130
-
131
-
132
-
133
-
134
-
135
-
136
-
137
-
138
-
139
-
140
-
141
-
142
-
143
 |
 |

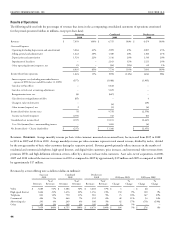
e following table sets forth the percentages of revenues that items in the accompanying consolidated statements of operations constituted
for the periods presented (dollars in millions, except per share data):
Successor Combined Predecessor
2010 2009 2008
Revenues $ 7,059 100% $ 6,755 100% $ 6,479 100%
Costs and Expenses:
Operating (excluding depreciation and amortization) 3,064 43% 2,909 43% 2,807 43%
Selling, general and administrative 1,422 20% 1,380 20% 1,386 21%
Depreciation and amortization 1,524 22% 1,316 20% 1,310 20%
Impairment of franchises -- -- 2,163 32% 1,521 24%
Other operating (income) expenses, net 25 -- (34) (1%) 69 1%
6,035 85% 7,734 114% 7,093 109%
Income (loss) from operations 1,024 15% (979) (14%) (614) (9%)
Interest expense, net (excluding unrecorded interest
expense of $558 for year ended December 31, 2009) (877) (1,088) (1,905)
Gain due to Plan effects -- 6,818 --
Gain due to fresh start accounting adjustments -- 5,659 --
Reorganization items, net (6) (647) --
Gain (loss) on extinguishment of debt (85) -- 4
Change in value of derivatives --
(4) (29)
Other income (expense), net 2 (1) (6)
Income (loss) before income taxes 58 9,758 (2,550)
Income tax benefit (expense) (295) 343 103
Consolidated net income (loss) (237) 10,101 (2,447)
Less: Net (income) loss – noncontrolling interest -- 1,265 (4)
Net Income (loss) – Charter shareholders $ (237) $ 11,366 $ (2,451)
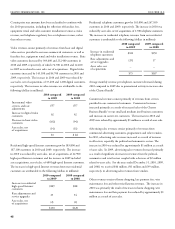
Revenues. Revenues. Average monthly revenue per basic video customer, measured on an annual basis, has increased from $105 in 2008
to $114 in 2009 and $126 in 2010. Average monthly revenue per video customer represents total annual revenue, divided by twelve, divided
by the average number of basic video customers during the respective period. Revenue growth primarily reflects increases in the number of
residential and commercial telephone, high-speed Internet, and digital video customers, price increases, and incremental video revenues from
premium, DVR, and high-definition television services, offset by a decrease in basic video customers. Asset sales, net of acquisitions, in 2008,
2009 and 2010 reduced the increase in revenues in 2010 as compared to 2009 by approximately $19 million and 2009 as compared to 2008
by approximately $17 million.
Revenues by service offering were as follows (dollars in millions):
Successor Combined Predecessor
2010 2009 2008 2010 over 2009 2009 over 2008
Revenues
% of
Revenues Revenues
% of
Revenues Revenues
% of
Revenues Change
%
Change Change
%
Change
Video $ 3,689 52% $ 3,686 54% $ 3,692 57% $ 3 -- $ (6) --
High-speed Internet 1,606 23% 1,476 22% 1,356 21% 130 9% 120 9%
Telephone 823 12% 750 11% 583 9% 73 10% 167 29%
Commercial 494 7% 446 7% 392 6% 48 11% 54 14%
Advertising sales 291 4% 249 4% 308 5% 42 17% (59) (19%)
Other 156 2% 148 2% 148 2% 8 5% -- --
$ 7,059 100% $ 6,755 100% $ 6,479 100% $ 304 5% $ 276 4%