Charter 2010 Annual Report Download - page 49
Download and view the complete annual report
Please find page 49 of the 2010 Charter annual report below. You can navigate through the pages in the report by either clicking on the pages listed below, or by using the keyword search tool below to find specific information within the annual report.-
 1
1 -
2
-
3
-
4
-
5
-
6
-
7
-
8
-
9
-
10
-
11
-
12
-
13
-
14
-
15
-
16
-
17
-
18
-
19
-
20
-
21
-
22
-
23
-
24
-
25
-
26
-
27
-
28
-
29
-
30
-
31
-
32
-
33
-
34
-
35
-
36
-
37
-
38
-
 39
39 -
 40
40 -
 41
41 -
 42
42 -
 43
43 -
 44
44 -
 45
45 -
 46
46 -
 47
47 -
 48
48 -
 49
49 -
 50
50 -
 51
51 -
 52
52 -
 53
53 -
 54
54 -
 55
55 -
 56
56 -
 57
57 -
 58
58 -
 59
59 -
60
-
61
-
62
-
63
-
64
-
65
-
66
-
67
-
68
-
69
-
70
-
71
-
72
-
73
-
74
-
75
-
76
-
77
-
78
-
79
-
80
-
81
-
82
-
83
-
84
-
85
-
86
-
87
-
88
-
89
-
90
-
91
-
92
-
93
-
94
-
95
-
96
-
97
-
98
-
99
-
100
-
101
-
102
-
103
-
104
-
105
-
106
-
107
-
108
-
109
-
110
-
111
-
112
-
113
-
114
-
115
-
116
-
117
-
118
-
119
-
120
-
121
-
122
-
123
-
124
-
125
-
126
-
127
-
128
-
129
-
130
-
131
-
132
-
133
-
134
-
135
-
136
-
137
-
138
-
139
-
140
-
141
-
142
-
143
 |
 |

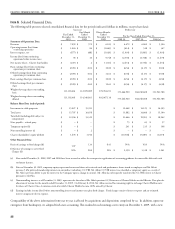
capital structure, a new accounting basis in the identifiable assets
and liabilities assumed and no retained earnings or accumulated
losses. Accordingly, the consolidated financial statements on or after
December 1, 2009 are not comparable to the consolidated financial
statements prior to that date. e financial statements for the periods
ended prior to November 30, 2009 do not include the effect of any
changes in our capital structure or changes in the fair value of assets
and liabilities as a result of fresh start accounting.
Management’s Discussion and Analysis of
Financial Condition and Results of Operations.
Reference is made to “Part I. Item 1A. Risk Factors” and “Cautionary
Statement Regarding Forward-Looking Statements,” which describe
important factors that could cause actual results to differ from
expectations and non-historical information contained herein. In
addition, the following discussion should be read in conjunction
with the audited consolidated financial statements and accompanying
notes thereto of Charter Communications, Inc. and subsidiaries
included in “Item 8. Financial Statements and Supplementary Data.”
Upon our emergence from bankruptcy on November 30, 2009,
we adopted fresh start accounting. In accordance with accounting
principles generally accepted in the United States (“GAAP”), the
accompanying consolidated statements of operations and cash flows
contained in “Item 8. Financial Statements and Supplementary Data”
present the results of operations and the sources and uses of cash for
(i) the eleven months ended November 30, 2009 of the Predecessor
and (ii) the one month ended December 31, 2009 of the Successor.
However, for purposes of management’s discussion and analysis of
the results of operations and the sources and uses of cash in this Form
10-K, we have combined the results of operations for the Predecessor
and the Successor for 2009. e results of operations of the
Predecessor and Successor are not comparable due to the change in
basis resulting from the emergence from bankruptcy. is combined
presentation is being made solely to explain the changes in results of
operations for the periods presented in the financial statements. We
also compare the combined results of operations and the sources and
uses of cash for the twelve months ended December 31, 2009 with
the corresponding periods in 2010 and 2008.
We believe the combined results of operations for the twelve months
ended December 31, 2009 provide management and investors
with a more meaningful perspective on our ongoing financial and
operational performance and trends than if we did not combine the
results of operations of the Predecessor and the Successor in this manner.
We are a cable operator providing services in the United States with
approximately 5.1 million customers at December 31, 2010. We offer
our customers video services, high-speed Internet access, and telephone
services, as well as advanced video services (such as OnDemand, high
definition television service and DVR). We also provide advertising
and backhaul services. See "Part I. Item 1. Business — Products
and Services" for further description of these services, including
"customers."
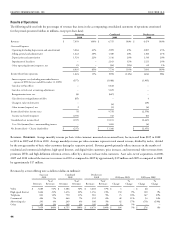
For the years ended December 31, 2010, 2009 and 2008, adjusted
earnings (loss) before interest expense, income taxes, depreciation and
amortization (“Adjusted EBITDA”) was $2.6 billion, $2.5 billion,
and $2.3 billion, respectively. See “—Use of Adjusted EBITDA
and Free Cash Flow” for further information on Adjusted EBITDA
and free cash flow. Adjusted EBITDA increased as a result of
continued growth in high-speed Internet and telephone customers
combined with growth in our commercial services and advertising
sales businesses. For the years ended December 31, 2010, our
income from operations was $1.0 billion and for the years ended
2009 and 2008, our loss from operations was $979 million and
$614 million, respectively. Our income from operations for the year
ended December 31, 2010 compared to the loss from operations for
the years ended December 31, 2009 and 2008 is primarily due to
impairment of franchises incurred during 2009 and 2008 that did
not recur in 2010.
We believe that continued competition and the weakened economic
conditions in the United States, including the housing market
and relatively high unemployment levels, have adversely affected
consumer demand for our services. In addition, we believe these
factors have contributed to an increase in the number of homes
that replace their traditional telephone service with wireless service
thereby impacting the growth of our telephone business. ese
conditions have affected our net customer additions and revenue
growth during 2009 and 2010, especially with our basic video
customers, and contributed to the franchise impairment charge
incurred in 2009. In 2009 and 2010, we experienced a reduction in
total customers of approximately 112,300 and 129,000, respectively.
If these conditions do not improve, we believe the growth of our
business and results of operations will be further adversely affected