Charter 2010 Annual Report Download - page 65
Download and view the complete annual report
Please find page 65 of the 2010 Charter annual report below. You can navigate through the pages in the report by either clicking on the pages listed below, or by using the keyword search tool below to find specific information within the annual report.-
 1
1 -
2
-
3
-
4
-
5
-
6
-
7
-
8
-
9
-
10
-
11
-
12
-
13
-
14
-
15
-
16
-
17
-
18
-
19
-
20
-
21
-
22
-
23
-
24
-
25
-
26
-
27
-
28
-
29
-
30
-
31
-
32
-
33
-
34
-
35
-
36
-
37
-
38
-
39
-
40
-
41
-
42
-
43
-
44
-
45
-
46
-
47
-
48
-
49
-
50
-
51
-
52
-
53
-
54
-
 55
55 -
 56
56 -
 57
57 -
 58
58 -
 59
59 -
 60
60 -
 61
61 -
 62
62 -
 63
63 -
 64
64 -
 65
65 -
 66
66 -
 67
67 -
 68
68 -
 69
69 -
 70
70 -
 71
71 -
 72
72 -
 73
73 -
 74
74 -
 75
75 -
76
-
77
-
78
-
79
-
80
-
81
-
82
-
83
-
84
-
85
-
86
-
87
-
88
-
89
-
90
-
91
-
92
-
93
-
94
-
95
-
96
-
97
-
98
-
99
-
100
-
101
-
102
-
103
-
104
-
105
-
106
-
107
-
108
-
109
-
110
-
111
-
112
-
113
-
114
-
115
-
116
-
117
-
118
-
119
-
120
-
121
-
122
-
123
-
124
-
125
-
126
-
127
-
128
-
129
-
130
-
131
-
132
-
133
-
134
-
135
-
136
-
137
-
138
-
139
-
140
-
141
-
142
-
143
 |
 |

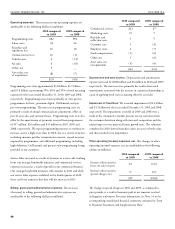
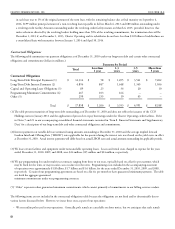
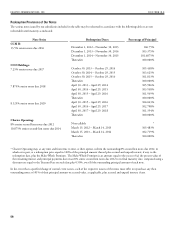
will recur. Rent expense incurred for pole rental attachments for
the years ended December 31, 2010, 2009, and 2008, was $50
million, $47 million and $47 million.
We pay franchise fees under multi-year franchise agreements
based on a percentage of revenues generated from video
service per year. We also pay other franchise related costs,
such as public education grants, under multi-year agreements.
Franchise fees and other franchise-related costs included in the
accompanying statement of operations were $178 million, $176
million and $179 million for the years ended December 31,
2010, 2009, and 2008, respectively.
We also have $73 million in letters of credit, primarily to our
various worker’s compensation, property and casualty, and general
liability carriers, as collateral for reimbursement of claims.
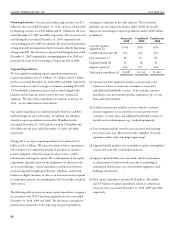
Limitations on Distributions
Distributions by Charter’s subsidiaries to a parent company for
payment of principal on parent company notes are restricted under
indentures and credit facilities governing our indebtedness, unless
there is no default under the applicable indenture and credit facilities,
and unless each applicable subsidiary’s leverage ratio test is met at
the time of such distribution. As of December 31, 2010, there was
no default under any of these indentures or credit facilities and each
subsidiary met its applicable leverage ratio tests based on December
31, 2010 financial results. Such distributions would be restricted,
however, if any such subsidiary fails to meet these tests at the time of
the contemplated distribution. In the past, certain subsidiaries have
from time to time failed to meet their leverage ratio test. ere can
be no assurance that they will satisfy these tests at the time of the
contemplated distribution. Distributions by Charter Operating for
payment of principal on parent company notes are further restricted
by the covenants in its credit facilities.
Distributions by CCO Holdings and Charter Operating to a parent
company for payment of parent company interest are permitted if
there is no default under the aforementioned indentures and CCO
Holdings and Charter Operating credit facilities.
In addition to the limitation on distributions under the various
indentures discussed above, distributions by our subsidiaries may
be limited by applicable law, including the Delaware Limited
Liability Company Act, under which our subsidiaries may only make
distributions if they have “surplus” as defined in the act. See “Part
•
•
I. Item 1A. Risk Factors —Restrictions in our subsidiaries’ debt
instruments and under applicable law limit their ability to provide
funds to us or our subsidiaries that are debt issuers.”
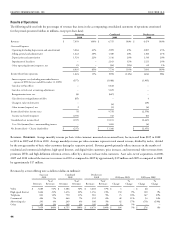
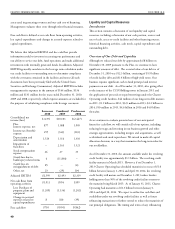
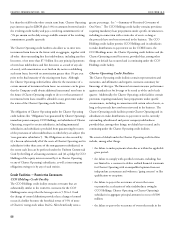
Historical Operating, Investing, and Financing Activities
Cash and Cash Equivalents. We held $32 million in cash and cash
equivalents, including $28 million of restricted cash, as of December
31, 2010 compared to $754 million as of December 31, 2009. e
decrease in cash resulted primarily from payments on our credit facilities.
Operating Activities. Net cash provided by operating activities
increased $1.3 billion from $594 million for the year ended
December 31, 2009 to $1.9 billion for the year ended December 31,
2010, primarily as the result of a decrease of $495 million in cash
paid for a swap termination liability, $365 million in cash paid for
interest, $182 million in cash paid for reorganization items other
than interest, changes in operating assets and liabilities that provided
$242 million more cash during the same period, and revenues
increasing at a faster rate than cash expenses.
Net cash provided by operating activities increased $195 million
from $399 million for the year ended December 31, 2008 to $594
million for the year ended December 31, 2009, primarily as a result
of a decrease of $747 million in cash paid for interest, and revenues
increasing at a faster rate than cash expenses. ese amounts were
partially offset by cash paid for a swap termination liability of $495
million and cash reorganization items of $188 million for the year
ended December 31, 2009.
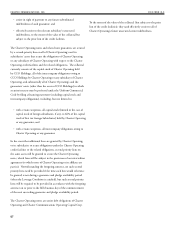
Investing Activities. Net cash used in investing activities for the
years ended December 31, 2010, 2009, and 2008, was $1.2 billion,
$1.3 billion and $1.2 billion, respectively. e decrease in 2010
compared to 2009 is primarily due to the purchase of the CC VIII
interest in 2009 in connection with the Plan, offset by an increase of
$75 million in purchases of property, plant and equipment as a result
of capital investments to enhance our residential and commercial
products and services capabilities. e increase in 2009 compared
to 2008 is primarily due to the purchase of the CC VIII interest in
2009 in connection with the Plan, offset by a decrease of $68 million
in purchases of property, plant, and equipment.