Charter 2010 Annual Report Download - page 140
Download and view the complete annual report
Please find page 140 of the 2010 Charter annual report below. You can navigate through the pages in the report by either clicking on the pages listed below, or by using the keyword search tool below to find specific information within the annual report.-
 1
1 -
2
-
3
-
4
-
5
-
6
-
7
-
8
-
9
-
10
-
11
-
12
-
13
-
14
-
15
-
16
-
17
-
18
-
19
-
20
-
21
-
22
-
23
-
24
-
25
-
26
-
27
-
28
-
29
-
30
-
31
-
32
-
33
-
34
-
35
-
36
-
37
-
38
-
39
-
40
-
41
-
42
-
43
-
44
-
45
-
46
-
47
-
48
-
49
-
50
-
51
-
52
-
53
-
54
-
55
-
56
-
57
-
58
-
59
-
60
-
61
-
62
-
63
-
64
-
65
-
66
-
67
-
68
-
69
-
70
-
71
-
72
-
73
-
74
-
75
-
76
-
77
-
78
-
79
-
80
-
81
-
82
-
83
-
84
-
85
-
86
-
87
-
88
-
89
-
90
-
91
-
92
-
93
-
94
-
95
-
96
-
97
-
98
-
99
-
100
-
101
-
102
-
103
-
104
-
105
-
106
-
107
-
108
-
109
-
110
-
111
-
112
-
113
-
114
-
115
-
116
-
117
-
118
-
119
-
120
-
121
-
122
-
123
-
124
-
125
-
126
-
127
-
128
-
129
-
 130
130 -
 131
131 -
 132
132 -
 133
133 -
 134
134 -
 135
135 -
 136
136 -
 137
137 -
 138
138 -
 139
139 -
 140
140 -
 141
141 -
 142
142 -
 143
143
 |
 |

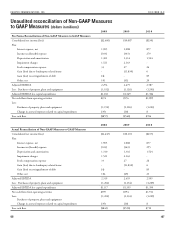
2008 2009 2010
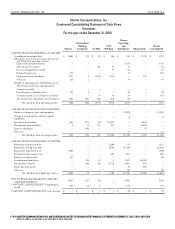
Pro Forma Reconciliation of Non-GAAP Measures to GAAP Measures
Consolidated net income (loss) ($2,460) $10,087 ($230)
Plus:
Interest expense, net 1,905 1,088 877
Income tax (benefit) expense (103) (343) 279
Depreciation and amortization 1,301 1,314 1,524
Impairment charges 1,521 2,163 -
Stock compensation expense 33 27 26
Gain (loss) due to bankruptcy related items - (11,830) 6
Gain (loss) on extinguishment of debt (4) - 85
Other, net 101 (31) 20
Adjusted EBITDA 2,294 2,475 2,587
Less: Purchases of property, plant and equipment (1,192) (1,126) (1,203)
Adjusted EBITDA less capital expenditures $1,102 $1,349 $1,384
Net cash flows from operating activities $374 $576 $1,899
Less:
Purchases of property, plant and equipment (1,192) (1,126) (1,203)
Change in accrued expenses related to capital expenditures (39) (10) 8
Free cash flow ($857) ($560) $704
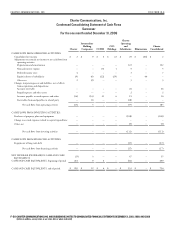
2008 2009 2010
Actual Reconciliation of Non-GAAP Measures to GAAP Measures
Consolidated net income (loss) ($2,447) $10,101 ($237)
Plus:
Interest expense, net 1,905 1,088 877
Income tax (benefit) expense (103) (343) 295
Depreciation and amortization 1,310 1,316 1,524
Impairment charges 1,521 2,163 -
Stock compensation expense 33 27 26
Gain (loss) due to bankruptcy related items - (11,830) 6
Gain (loss) on extinguishment of debt (4) - 85
Other, net 104 (29) 23
Adjusted EBITDA 2,319 2,493 2,599
Less: Purchases of property, plant and equipment (1,202) (1,134) (1,209)
Adjusted EBITDA less capital expenditures $1,117 $1,359 $1,390
Net cash flows from operating activities $399 $594 $1,911
Less:
Purchases of property, plant and equipment
(1,202) (1,134) (1,209)
Change in accrued expenses related to capital expenditures (39) (10) 8
Free cash flow ($842) ($550) $710