Charter 2010 Annual Report Download - page 95
Download and view the complete annual report
Please find page 95 of the 2010 Charter annual report below. You can navigate through the pages in the report by either clicking on the pages listed below, or by using the keyword search tool below to find specific information within the annual report.-
 1
1 -
2
-
3
-
4
-
5
-
6
-
7
-
8
-
9
-
10
-
11
-
12
-
13
-
14
-
15
-
16
-
17
-
18
-
19
-
20
-
21
-
22
-
23
-
24
-
25
-
26
-
27
-
28
-
29
-
30
-
31
-
32
-
33
-
34
-
35
-
36
-
37
-
38
-
39
-
40
-
41
-
42
-
43
-
44
-
45
-
46
-
47
-
48
-
49
-
50
-
51
-
52
-
53
-
54
-
55
-
56
-
57
-
58
-
59
-
60
-
61
-
62
-
63
-
64
-
65
-
66
-
67
-
68
-
69
-
70
-
71
-
72
-
73
-
74
-
75
-
76
-
77
-
78
-
79
-
80
-
81
-
82
-
83
-
84
-
 85
85 -
 86
86 -
 87
87 -
 88
88 -
 89
89 -
 90
90 -
 91
91 -
 92
92 -
 93
93 -
 94
94 -
 95
95 -
 96
96 -
 97
97 -
 98
98 -
 99
99 -
 100
100 -
 101
101 -
 102
102 -
 103
103 -
 104
104 -
 105
105 -
106
-
107
-
108
-
109
-
110
-
111
-
112
-
113
-
114
-
115
-
116
-
117
-
118
-
119
-
120
-
121
-
122
-
123
-
124
-
125
-
126
-
127
-
128
-
129
-
130
-
131
-
132
-
133
-
134
-
135
-
136
-
137
-
138
-
139
-
140
-
141
-
142
-
143
 |
 |

F-0 F-PB
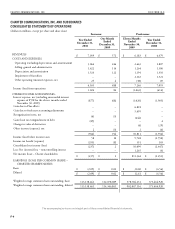
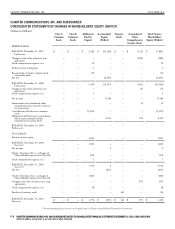
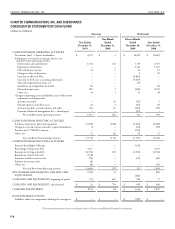
CHARTER COMMUNICATIONS, INC. AND SUBSIDIARIES NOTES TO CONSOLIDATED FINANCIAL STATEMENTS DECEMBER 31, 2010, 2009, AND 2008
(dollars in millions, except share or per share data or where indicated)
Revenue Recognition
Revenues from residential and commercial video, high-speed Internet and telephone services are recognized when the related services are
provided. Advertising sales are recognized at estimated realizable values in the period that the advertisements are broadcast. Franchise fees
imposed by local governmental authorities are collected on a monthly basis from the Company’s customers and are periodically remitted to
local franchise authorities. Franchise fees of $182 million, $15 million, $166 million and $187 million for the year ended December 31,
2010 (Successor), one month ended December 31, 2009 (Successor), eleven months ended November 30, 2009 (Predecessor) and year ended
December 31, 2008 (Predecessor), respectively, are reported in video revenues, on a gross basis with a corresponding operating expense. Sales
taxes collected and remitted to state and local authorities are recorded on a net basis.
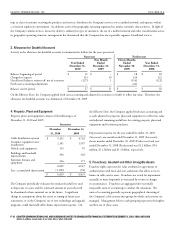
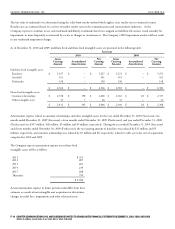
e Company’s revenues by product line are as follows:
Successor Predecessor
Year Ended
December 31,
2010
One Month
Ended
December 31,
2009
Eleven Months
Ended
November 30,
2009
Year Ended
December 31,
2008
Video $ 3,689 $ 306 $ 3,380 $ 3,692
High-speed Internet 1,606 127 1,349 1,356
Telephone 823 65 685 583
Commercial 494 39 407 392
Advertising sales 291 22 227 308
Other 156 13 135 148
$ 7,059 $ 572 $ 6,183 $ 6,479
Certain prior year amounts have been reclassified to conform with the 2010 presentation, including the reflection of franchise fees, equipment
rental and video customer installation revenue as video revenue, and telephone regulatory fees as telephone revenue, rather than other revenue.
December 31, 2010 (Successor) and 2009 (Successor), the deferred
amounts of such economic consideration, included in other long-
term liabilities, were $11 million and $26 million, respectively.
Programming costs included in the accompanying statements of
operations were $1.8 billion, $146 million, $1.6 billion and $1.6
billion for the year ended December 31, 2010 (Successor), one
month ended December 31, 2009 (Successor), eleven months ended
November 30, 2009 (Predecessor) and year ended December 31,
2008 (Predecessor), respectively.
Advertising Costs
Advertising costs associated with marketing the Company’s products
and services are generally expensed as costs are incurred. Such
advertising expense was $282 million, $20 million, $230 million and
$229 million for the year ended December 31, 2010 (Successor), one
month ended December 31, 2009 (Successor), eleven months ended
November 30, 2009 (Predecessor) and year ended December 31,
2008 (Predecessor), respectively.
Programming Costs
e Company has various contracts to obtain basic, digital and
premium video programming from programming vendors whose
compensation is typically based on a flat fee per customer. e
cost of the right to exhibit network programming under such
arrangements is recorded in operating expenses in the month the
programming is available for exhibition. Programming costs are
paid each month based on calculations performed by the Company
and are subject to periodic audits performed by the programmers.
Certain programming contracts contain incentives to be paid by
the programmers. e Company receives these payments and
recognizes the incentives on a straight-line basis over the life of the
programming agreement as a reduction of programming expense.
is offset to programming expense was $17 million, $2 million,
$24 million, and $33 million for the year ended December 31, 2010
(Successor), one month ended December 31, 2009 (Successor),
eleven months ended November 30, 2009 (Predecessor) and
year ended December 31, 2008 (Predecessor), respectively. As of