Coca Cola 2008 Annual Report Download - page 102
Download and view the complete annual report
Please find page 102 of the 2008 Coca Cola annual report below. You can navigate through the pages in the report by either clicking on the pages listed below, or by using the keyword search tool below to find specific information within the annual report.-
 1
1 -
2
-
3
-
4
-
5
-
6
-
7
-
8
-
9
-
10
-
11
-
12
-
13
-
14
-
15
-
16
-
17
-
18
-
19
-
20
-
21
-
22
-
23
-
24
-
25
-
26
-
27
-
28
-
29
-
30
-
31
-
32
-
33
-
34
-
35
-
36
-
37
-
38
-
39
-
40
-
41
-
42
-
43
-
44
-
45
-
46
-
47
-
48
-
49
-
50
-
51
-
52
-
53
-
54
-
55
-
56
-
57
-
58
-
59
-
60
-
61
-
62
-
63
-
64
-
65
-
66
-
67
-
68
-
69
-
70
-
71
-
72
-
73
-
74
-
75
-
76
-
77
-
78
-
79
-
80
-
81
-
82
-
83
-
84
-
85
-
86
-
87
-
88
-
89
-
90
-
91
-
 92
92 -
 93
93 -
 94
94 -
 95
95 -
 96
96 -
 97
97 -
 98
98 -
 99
99 -
 100
100 -
 101
101 -
 102
102 -
 103
103 -
 104
104 -
 105
105 -
 106
106 -
 107
107 -
 108
108 -
 109
109 -
 110
110 -
 111
111 -
 112
112 -
113
-
114
-
115
-
116
-
117
-
118
-
119
-
120
-
121
-
122
-
123
-
124
-
125
-
126
-
127
-
128
-
129
-
130
-
131
-
132
-
133
-
134
-
135
-
136
-
137
-
138
-
139
-
140
-
141
-
142
-
143
-
144
-
145
-
146
-
147
-
148
-
149
-
150
-
151
-
152
-
153
-
154
-
155
-
156
-
157
-
158
-
159
-
160
-
161
-
162
-
163
-
164
-
165
-
166
-
167
-
168
 |
 |

THE COCA-COLA COMPANY AND SUBSIDIARIES
NOTES TO CONSOLIDATED FINANCIAL STATEMENTS
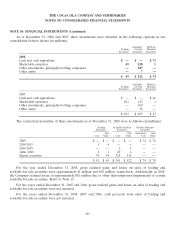
NOTE 10: FINANCIAL INSTRUMENTS
Certain Debt and Marketable Equity Securities
Investments in debt and marketable equity securities, other than investments accounted for by the equity
method, are categorized as trading, available-for-sale or held-to-maturity. Our marketable equity investments
are categorized as trading or available-for-sale with their cost basis determined by the specific identification
method. Realized and unrealized gains and losses on trading securities and realized gains and losses on
available-for-sale securities are included in net income. Unrealized gains and losses, net of deferred taxes, on
available-for-sale securities are included in our consolidated balance sheets as a component of AOCI. Debt
securities categorized as held-to-maturity are stated at amortized cost.
As of December 31, 2008 and 2007, trading, available-for-sale and held-to-maturity securities consisted of
the following (in millions):
Gross Unrealized Estimated
Cost Gains Losses Fair Value
2008
Trading securities1:
Equity securities $ 74 $ — $ (30) $ 44
Other securities 7— (2) 5
$ 81 $ — $ (32) $ 49
Available-for-sale securities1:
Equity securities $ 329 $ 193 $ (7) $ 515
Other securities 12 — (5) 7
$ 341 $ 193 $ (12) $ 522
Held-to-maturity securities:
Bank and corporate debt $74 $— $— $74
1The fair value of the trading and available-for-sale securities included in the table above were determined
in accordance with SFAS No. 157. Refer to Note 12.
Gross Unrealized Estimated
Cost Gains Losses Fair Value
2007
Trading securities:
Equity securities $ 90 $ 2 $ — $ 92
Other securities 12 — (3) 9
$ 102 $ 2 $ (3) $ 101
Available-for-sale securities:
Equity securities $ 235 $ 247 $ — $ 482
Other securities 17 — (2) 15
$ 252 $ 247 $ (2) $ 497
Held-to-maturity securities:
Bank and corporate debt $ 67 $ — $ — $ 67
100