Coca Cola 2008 Annual Report Download - page 53
Download and view the complete annual report
Please find page 53 of the 2008 Coca Cola annual report below. You can navigate through the pages in the report by either clicking on the pages listed below, or by using the keyword search tool below to find specific information within the annual report.-
 1
1 -
2
-
3
-
4
-
5
-
6
-
7
-
8
-
9
-
10
-
11
-
12
-
13
-
14
-
15
-
16
-
17
-
18
-
19
-
20
-
21
-
22
-
23
-
24
-
25
-
26
-
27
-
28
-
29
-
30
-
31
-
32
-
33
-
34
-
35
-
36
-
37
-
38
-
39
-
40
-
41
-
42
-
 43
43 -
 44
44 -
 45
45 -
 46
46 -
 47
47 -
 48
48 -
 49
49 -
 50
50 -
 51
51 -
 52
52 -
 53
53 -
 54
54 -
 55
55 -
 56
56 -
 57
57 -
 58
58 -
 59
59 -
 60
60 -
 61
61 -
 62
62 -
 63
63 -
64
-
65
-
66
-
67
-
68
-
69
-
70
-
71
-
72
-
73
-
74
-
75
-
76
-
77
-
78
-
79
-
80
-
81
-
82
-
83
-
84
-
85
-
86
-
87
-
88
-
89
-
90
-
91
-
92
-
93
-
94
-
95
-
96
-
97
-
98
-
99
-
100
-
101
-
102
-
103
-
104
-
105
-
106
-
107
-
108
-
109
-
110
-
111
-
112
-
113
-
114
-
115
-
116
-
117
-
118
-
119
-
120
-
121
-
122
-
123
-
124
-
125
-
126
-
127
-
128
-
129
-
130
-
131
-
132
-
133
-
134
-
135
-
136
-
137
-
138
-
139
-
140
-
141
-
142
-
143
-
144
-
145
-
146
-
147
-
148
-
149
-
150
-
151
-
152
-
153
-
154
-
155
-
156
-
157
-
158
-
159
-
160
-
161
-
162
-
163
-
164
-
165
-
166
-
167
-
168
 |
 |

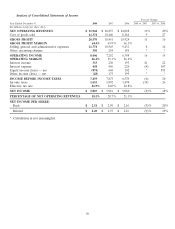
Net Operating Revenues
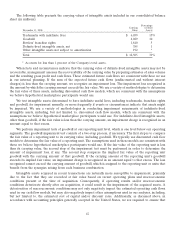
Net operating revenues increased by $3,087 million, or 11 percent, in 2008 compared to 2007 and by
$4,769 million, or 20 percent, in 2007 compared to 2006. The following table illustrates, on a percentage basis,
the estimated impact of key factors resulting in increases in net operating revenues:
Percent Change
Year Ended December 31, 2008 vs. 2007 2007 vs. 2006
Increase in concentrate sales volume 4% 6%
Structural changes — 8
Price and product/geographic mix 3 2
Impact of currency fluctuations versus the U.S. dollar 4 4
Total percentage increase 11% 20%
Refer to the heading ‘‘Beverage Volume’’ for a discussion of concentrate sales volume. Also included in
concentrate sales volume is the impact of acquired beverage companies, including, among others, glac´
eau, and
the acquisition of trademarks.
‘‘Structural changes’’ refers to acquisitions or dispositions of bottling, distribution or canning operations
and consolidation or deconsolidation of bottling and distribution entities for accounting purposes. Structural
changes had a net zero percent impact on net operating revenues in 2008 compared to 2007. The increase in net
operating revenues attributable to the full year impact of prior year acquisitions, including, but not limited to, 18
German bottling and distribution operations, NORSA and CCBPI was offset by the sale of Remil and the sale of
a portion of our ownership interest in Coca-Cola Pakistan, which resulted in its deconsolidation. Refer to Note 3
and Note 20 of Notes to Consolidated Financial Statements.
Price and product/geographic mix increased net operating revenues by 3 percent in 2008 compared to 2007,
primarily due to favorable pricing and product/package mix across the majority of the operating segments.
The favorable impact of currency fluctuations increased net operating revenues by 4 percent in 2008
compared to 2007. The U.S. dollar weakened against certain key currencies in 2008 including, but not limited to,
the euro, Japanese yen and Brazilian real. The fluctuations in these currencies favorably impacted the Europe,
Pacific, Latin America and Bottling Investments operating segments. The favorable impact of fluctuations in the
aforementioned currencies was partially offset by the unfavorable impact of the U.S. dollar strengthening against
the South African rand and the British pound during 2008. The fluctuations in these currencies unfavorably
impacted the Eurasia and Africa, Europe and Bottling Investments operating segments. Refer to the heading
‘‘Liquidity, Capital Resources and Financial Position—Foreign Exchange.’’
In 2007, structural changes increased net operating revenues by 8 percent compared to 2006. The increase
in net operating revenues attributable to structural changes was primarily due to the impact of acquisitions made
during 2007, including, but not limited to, 18 German bottling and distribution operations, NORSA and CCBPI.
In addition to the partial year impact of 2007 acquisitions, the full year impact of the acquisition of CCCIL and
the consolidation of Brucephil, Inc. (‘‘Brucephil’’), the parent company of The Philadelphia Coca-Cola Bottling
Company, during 2006 also contributed to increased net operating revenues during 2007. Refer to Note 20 of
Notes to Consolidated Financial Statements.
Price and product/geographic mix increased net operating revenues by 2 percent in 2007 versus 2006,
primarily due to favorable pricing and product/package mix across the majority of the operating segments.
The favorable impact of currency fluctuations increased net operating revenues by 4 percent in 2007
compared to 2006. The U.S. dollar weakened against most key currencies during 2007 including, but not limited
to, the euro, Brazilian real and Australian dollar. The fluctuations in these currencies favorably impacted the
Europe, Latin America, Pacific and Bottling Investments operating segments. The favorable impact of
fluctuations in the aforementioned currencies was partially offset by the unfavorable impact of the U.S. dollar
51