Coca Cola 2008 Annual Report Download - page 71
Download and view the complete annual report
Please find page 71 of the 2008 Coca Cola annual report below. You can navigate through the pages in the report by either clicking on the pages listed below, or by using the keyword search tool below to find specific information within the annual report.-
 1
1 -
2
-
3
-
4
-
5
-
6
-
7
-
8
-
9
-
10
-
11
-
12
-
13
-
14
-
15
-
16
-
17
-
18
-
19
-
20
-
21
-
22
-
23
-
24
-
25
-
26
-
27
-
28
-
29
-
30
-
31
-
32
-
33
-
34
-
35
-
36
-
37
-
38
-
39
-
40
-
41
-
42
-
43
-
44
-
45
-
46
-
47
-
48
-
49
-
50
-
51
-
52
-
53
-
54
-
55
-
56
-
57
-
58
-
59
-
60
-
 61
61 -
 62
62 -
 63
63 -
 64
64 -
 65
65 -
 66
66 -
 67
67 -
 68
68 -
 69
69 -
 70
70 -
 71
71 -
 72
72 -
 73
73 -
 74
74 -
 75
75 -
 76
76 -
 77
77 -
 78
78 -
 79
79 -
 80
80 -
 81
81 -
82
-
83
-
84
-
85
-
86
-
87
-
88
-
89
-
90
-
91
-
92
-
93
-
94
-
95
-
96
-
97
-
98
-
99
-
100
-
101
-
102
-
103
-
104
-
105
-
106
-
107
-
108
-
109
-
110
-
111
-
112
-
113
-
114
-
115
-
116
-
117
-
118
-
119
-
120
-
121
-
122
-
123
-
124
-
125
-
126
-
127
-
128
-
129
-
130
-
131
-
132
-
133
-
134
-
135
-
136
-
137
-
138
-
139
-
140
-
141
-
142
-
143
-
144
-
145
-
146
-
147
-
148
-
149
-
150
-
151
-
152
-
153
-
154
-
155
-
156
-
157
-
158
-
159
-
160
-
161
-
162
-
163
-
164
-
165
-
166
-
167
-
168
 |
 |

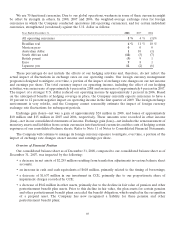
We use 70 functional currencies. Due to our global operations, weakness in some of these currencies might
be offset by strength in others. In 2008, 2007 and 2006, the weighted-average exchange rates for foreign
currencies in which the Company conducted operations (all operating currencies), and for certain individual
currencies, strengthened (weakened) against the U.S. dollar as follows:
Year Ended December 31, 2008 2007 2006
All operating currencies 5% 4 % (1)%
Brazilian real 6% 11 % 10 %
Mexican peso 000
Australian dollar 110 (1)
South African rand (18) (3) (7)
British pound (9) 91
Euro 981
Japanese yen 12 (2) (6)
These percentages do not include the effects of our hedging activities and, therefore, do not reflect the
actual impact of fluctuations in exchange rates on our operating results. Our foreign currency management
program is designed to mitigate, over time, a portion of the impact of exchange rate changes on our net income
and earnings per share. The total currency impact on operating income, including the effect of our hedging
activities, was an increase of approximately 6 percent in 2008 and an increase of approximately 4 percent in 2007.
The impact of a stronger U.S. dollar reduced our operating income by approximately 1 percent in 2006. Based
on the anticipated benefits of hedging coverage in place, the Company currently expects currencies to have a
10 percent to 12 percent negative impact on operating income in the first quarter of 2009. The foreign exchange
environment is very volatile, and the Company cannot reasonably estimate the impact of foreign currency
exchange rate fluctuations for subsequent periods.
Exchange gain (loss)—net was a gain of approximately $24 million in 2008, and losses of approximately
$10 million and $15 million in 2007 and 2006, respectively. These amounts were recorded in other income
(loss)—net in our consolidated statements of income. Exchange gain (loss)—net includes the remeasurement of
monetary assets and liabilities from certain currencies into functional currencies and the costs of hedging certain
exposures of our consolidated balance sheets. Refer to Note 11 of Notes to Consolidated Financial Statements.
The Company will continue to manage its foreign currency exposure to mitigate, over time, a portion of the
impact of exchange rate changes on net income and earnings per share.
Overview of Financial Position
Our consolidated balance sheet as of December 31, 2008, compared to our consolidated balance sheet as of
December 31, 2007, was impacted by the following:
• a decrease in net assets of $2,285 million resulting from translation adjustments in various balance sheet
accounts;
• an increase in cash and cash equivalents of $608 million, primarily related to the timing of borrowings;
• a decrease of $1,637 million in our investment in CCE, primarily due to our proportionate share of
impairment charges recorded by CCE;
• a decrease of $942 million in other assets, primarily due to the decline in fair value of pension and other
postretirement benefit plan assets. Prior to this decline in fair value, the plan assets for certain pension
and other postretirement benefit plans exceeded the benefit obligation, which resulted in the recognition
of a prepaid asset. The Company has now recognized a liability for these pension and other
postretirement benefit plans;
69