Coca Cola 2008 Annual Report Download - page 141
Download and view the complete annual report
Please find page 141 of the 2008 Coca Cola annual report below. You can navigate through the pages in the report by either clicking on the pages listed below, or by using the keyword search tool below to find specific information within the annual report.-
 1
1 -
2
-
3
-
4
-
5
-
6
-
7
-
8
-
9
-
10
-
11
-
12
-
13
-
14
-
15
-
16
-
17
-
18
-
19
-
20
-
21
-
22
-
23
-
24
-
25
-
26
-
27
-
28
-
29
-
30
-
31
-
32
-
33
-
34
-
35
-
36
-
37
-
38
-
39
-
40
-
41
-
42
-
43
-
44
-
45
-
46
-
47
-
48
-
49
-
50
-
51
-
52
-
53
-
54
-
55
-
56
-
57
-
58
-
59
-
60
-
61
-
62
-
63
-
64
-
65
-
66
-
67
-
68
-
69
-
70
-
71
-
72
-
73
-
74
-
75
-
76
-
77
-
78
-
79
-
80
-
81
-
82
-
83
-
84
-
85
-
86
-
87
-
88
-
89
-
90
-
91
-
92
-
93
-
94
-
95
-
96
-
97
-
98
-
99
-
100
-
101
-
102
-
103
-
104
-
105
-
106
-
107
-
108
-
109
-
110
-
111
-
112
-
113
-
114
-
115
-
116
-
117
-
118
-
119
-
120
-
121
-
122
-
123
-
124
-
125
-
126
-
127
-
128
-
129
-
130
-
 131
131 -
 132
132 -
 133
133 -
 134
134 -
 135
135 -
 136
136 -
 137
137 -
 138
138 -
 139
139 -
 140
140 -
 141
141 -
 142
142 -
 143
143 -
 144
144 -
 145
145 -
 146
146 -
 147
147 -
 148
148 -
 149
149 -
 150
150 -
 151
151 -
152
-
153
-
154
-
155
-
156
-
157
-
158
-
159
-
160
-
161
-
162
-
163
-
164
-
165
-
166
-
167
-
168
 |
 |

THE COCA-COLA COMPANY AND SUBSIDIARIES
NOTES TO CONSOLIDATED FINANCIAL STATEMENTS
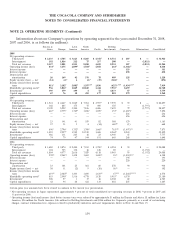
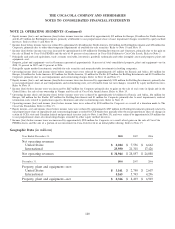
NOTE 21: OPERATING SEGMENTS (Continued)
Information about our Company’s operations by operating segment for the years ended December 31, 2008,
2007 and 2006, is as follows (in millions):
Eurasia & Latin North Bottling
Africa Europe America America Pacific Investments Corporate Eliminations Consolidated
2008
Net operating revenues:
Third party $ 2,135 $ 4,785 $ 3,623 $ 8,205 $ 4,3581$ 8,731 $ 107 $ — $ 31,944
Intersegment 192 1,016 212 75 337 200 — (2,032) —
Total net revenues 2,327 5,801 3,835 8,280 4,695 8,931 107 (2,032) 31,944
Operating income (loss) 83423,175 2,09921,58421,858 2642(1,368)2— 8,446
Interest income — — — — — — 333 — 333
Interest expense — — — — — — 438 — 438
Depreciation and
amortization 26 169 42 376 78 409 128 — 1,228
Equity income (loss) — net (14) (4)36(2)
3(19) (844)33 — (874)
Income (loss) before income
taxes 81123,18232,08221,5872,3,4 1,836 (625)2,3,4,5 (1,434)2,4,5 — 7,439
Identifiable operating assets6956 3,01271,849 10,845 1,444 7,93578,699 — 34,740
Investments8395 179 199 4 72 4,873 57 — 5,779
Capital expenditures 67 76 58 493 177 818 279 — 1,968
2007
Net operating revenues:
Third party $ 1,941 $ 4,447 $ 3,069 $ 7,761 $ 3,9971$ 7,570 $ 72 $ — $ 28,857
Intersegment 168 845 175 75 409 125 — (1,797) —
Total net revenues 2,109 5,292 3,244 7,836 4,406 7,695 72 (1,797) 28,857
Operating income (loss) 66792,77591,74991,69691,69991539(1,487)9— 7,252
Interest income — — — — — — 236 — 236
Interest expense — — — — — — 456 — 456
Depreciation and
amortization 23 141 41 359 82 388 129 — 1,163
Equity income (loss) — net 37 11 1 4 (14) 63010 (1) — 668
Income (loss) before income
taxes 69692,79691,75291,70091,66597619,10 (1,497)9,11 — 7,873
Identifiable operating assets61,023 2,99771,989 10,510 1,468 8,96278,543 — 35,492
Investments8386 111 245 18 23 6,949 45 — 7,777
Capital expenditures 74 79 47 344 191 645 268 — 1,648
2006
Net operating revenues:
Third party $ 1,680 $ 3,874 $ 2,484 $ 7,013 $ 3,9901$ 4,954 $ 93 $ — $ 24,088
Intersegment 124 703 132 16 128 89 — (1,192) —
Total net revenues 1,804 4,577 2,616 7,029 4,118 5,043 93 (1,192) 24,088
Operating income (loss) 59212 2,36112 1,438 1,683 1,65012 1812 (1,434)12,13 — 6,308
Interest income — — — — — — 193 — 193
Interest expense — — — — — — 220 — 220
Depreciation and
amortization 23 101 25 361 60 278 90 — 938
Equity income (loss) — net 38 11 (2) 9 (10) 5614 — — 102
Income (loss) before income
taxes 61912 2,38012 1,433 1,690 1,63312 6712,14 (1,244)12,13,15 — 6,578
Identifiable operating assets6853 2,59071,516 4,778 1,120 5,95376,370 — 23,180
Investments8328 97 1 17 16 6,302 22 — 6,783
Capital expenditures 42 94 44 421 133 418 255 — 1,407
Certain prior year amounts have been revised to conform to the current year presentation.
1Net operating revenues in Japan represented approximately 9 percent of total consolidated net operating revenues in 2008, 9 percent in 2007 and
11 percent in 2006.
2Operating income (loss) and income (loss) before income taxes were reduced by approximately $1 million for Eurasia and Africa, $1 million for Latin
America, $56 million for North America, $46 million for Bottling Investments and $246 million for Corporate, primarily as a result of restructuring
charges, contract termination fees, expenses related to productivity initiatives and asset impairments. Refer to Note 18 and Note 19.
139