Coca Cola 2008 Annual Report Download - page 42
Download and view the complete annual report
Please find page 42 of the 2008 Coca Cola annual report below. You can navigate through the pages in the report by either clicking on the pages listed below, or by using the keyword search tool below to find specific information within the annual report.-
 1
1 -
2
-
3
-
4
-
5
-
6
-
7
-
8
-
9
-
10
-
11
-
12
-
13
-
14
-
15
-
16
-
17
-
18
-
19
-
20
-
21
-
22
-
23
-
24
-
25
-
26
-
27
-
28
-
29
-
30
-
31
-
 32
32 -
 33
33 -
 34
34 -
 35
35 -
 36
36 -
 37
37 -
 38
38 -
 39
39 -
 40
40 -
 41
41 -
 42
42 -
 43
43 -
 44
44 -
 45
45 -
 46
46 -
 47
47 -
 48
48 -
 49
49 -
 50
50 -
 51
51 -
 52
52 -
53
-
54
-
55
-
56
-
57
-
58
-
59
-
60
-
61
-
62
-
63
-
64
-
65
-
66
-
67
-
68
-
69
-
70
-
71
-
72
-
73
-
74
-
75
-
76
-
77
-
78
-
79
-
80
-
81
-
82
-
83
-
84
-
85
-
86
-
87
-
88
-
89
-
90
-
91
-
92
-
93
-
94
-
95
-
96
-
97
-
98
-
99
-
100
-
101
-
102
-
103
-
104
-
105
-
106
-
107
-
108
-
109
-
110
-
111
-
112
-
113
-
114
-
115
-
116
-
117
-
118
-
119
-
120
-
121
-
122
-
123
-
124
-
125
-
126
-
127
-
128
-
129
-
130
-
131
-
132
-
133
-
134
-
135
-
136
-
137
-
138
-
139
-
140
-
141
-
142
-
143
-
144
-
145
-
146
-
147
-
148
-
149
-
150
-
151
-
152
-
153
-
154
-
155
-
156
-
157
-
158
-
159
-
160
-
161
-
162
-
163
-
164
-
165
-
166
-
167
-
168
 |
 |

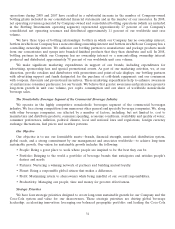
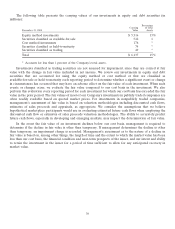
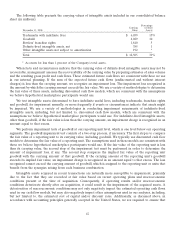
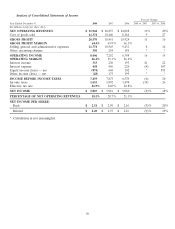
The following table presents the difference between calculated fair values, based on quoted closing prices of
publicly traded shares, and our Company’s cost basis in publicly traded bottlers accounted for as equity method
investments (in millions):
Fair Carrying
December 31, 2008 Value Value Difference
Coca-Cola FEMSA, S.A.B. de C.V. $ 2,616 $ 877 $ 1,739
Coca-Cola Enterprises Inc.12,032 — 2,032
Coca-Cola Amatil Limited 1,326 638 688
Coca-Cola Hellenic Bottling Company S.A. 1,231 1,487 (256)
Grupo Continental, S.A.B. 267 152 115
Coca-Cola Icecek A.S. 205 114 91
Coca-Cola Embonor S.A.2153 162 (9)
Coca-Cola Bottling Co. Consolidated 114 76 38
Embotelladoras Coca-Cola Polar S.A. 78 61 17
$ 8,022 $ 3,567 $ 4,455
1The carrying value of our investment in CCE was reduced to zero as of December 31, 2008, primarily
as a result of recording our proportionate share of impairment charges and items impacting AOCI
recorded by CCE.
2The carrying value of our investment in Coca-Cola Embonor S.A. exceeded its fair value as of
December 31, 2008. Management has concluded that this decline in fair value is temporary in nature.
The carrying value of our investment in Coca-Cola Hellenic has exceeded its fair value in each of the last
three months of 2008; however, the amount by which our carrying value has exceeded its fair value has decreased
in each of those three months. As is the case with most of our equity method investees, we have both the ability
and intent to hold our investment in Coca-Cola Hellenic as a long-term investment. Furthermore, under the
terms of a shareholders agreement between the Company and another significant shareholder of Coca-Cola
Hellenic, the Company is required, unless both parties agree to the contrary, to maintain no less than a
20 percent ownership interest in Coca-Cola Hellenic through at least December 31, 2018. Additionally, we
believe that the countries in which Coca-Cola Hellenic has bottling and distribution rights, through direct
ownership or joint ventures, have positive growth opportunities. We also believe that the recent volatility of
Coca-Cola Hellenic’s fair value is at least partly attributable to the volatility in the global financial markets and
not necessarily indicative of a change in long-term value. Based on these factors, management has concluded
that the decline in fair value of our investment in Coca-Cola Hellenic is temporary in nature. We will continue to
monitor our investments in future periods.
As of December 31, 2008, the Company had several investments classified as available-for-sale securities in
which our cost basis exceeded the fair value of the investment, each of which initially occurred between the end
of the second quarter and the beginning of the third quarter of 2008. Management assessed each individual
investment to determine if the decline in fair value was other than temporary. Based on these assessments,
management determined that the decline in fair value of each investment was other than temporary based on a
number of factors, including, but not limited to, uncertainty regarding our intent to hold certain of these
investments for a period of time that would be sufficient to recover our cost basis in the event of a market
recovery; the fact that the fair value of each investment has continued to decline since the time that our cost
basis initially exceeded its fair value; and the Company’s uncertainty around the near-term prospects for certain
of the investments. As a result of the other-than-temporary decline in fair value of these investments, the
Company recognized impairment charges of approximately $81 million during the fourth quarter of 2008.
Certain of these investments are classified as marketable securities, while others are classified as other
investments in the consolidated balance sheets. These impairment charges were recorded to other income
(loss)—net in the consolidated statement of income. Refer to the heading ‘‘Operations Review—Other Income
(Loss)—Net,’’ and Note 10 and Note 19 of Notes to Consolidated Financial Statements.
40