Coca Cola 2008 Annual Report Download - page 57
Download and view the complete annual report
Please find page 57 of the 2008 Coca Cola annual report below. You can navigate through the pages in the report by either clicking on the pages listed below, or by using the keyword search tool below to find specific information within the annual report.-
 1
1 -
2
-
3
-
4
-
5
-
6
-
7
-
8
-
9
-
10
-
11
-
12
-
13
-
14
-
15
-
16
-
17
-
18
-
19
-
20
-
21
-
22
-
23
-
24
-
25
-
26
-
27
-
28
-
29
-
30
-
31
-
32
-
33
-
34
-
35
-
36
-
37
-
38
-
39
-
40
-
41
-
42
-
43
-
44
-
45
-
46
-
 47
47 -
 48
48 -
 49
49 -
 50
50 -
 51
51 -
 52
52 -
 53
53 -
 54
54 -
 55
55 -
 56
56 -
 57
57 -
 58
58 -
 59
59 -
 60
60 -
 61
61 -
 62
62 -
 63
63 -
 64
64 -
 65
65 -
 66
66 -
 67
67 -
68
-
69
-
70
-
71
-
72
-
73
-
74
-
75
-
76
-
77
-
78
-
79
-
80
-
81
-
82
-
83
-
84
-
85
-
86
-
87
-
88
-
89
-
90
-
91
-
92
-
93
-
94
-
95
-
96
-
97
-
98
-
99
-
100
-
101
-
102
-
103
-
104
-
105
-
106
-
107
-
108
-
109
-
110
-
111
-
112
-
113
-
114
-
115
-
116
-
117
-
118
-
119
-
120
-
121
-
122
-
123
-
124
-
125
-
126
-
127
-
128
-
129
-
130
-
131
-
132
-
133
-
134
-
135
-
136
-
137
-
138
-
139
-
140
-
141
-
142
-
143
-
144
-
145
-
146
-
147
-
148
-
149
-
150
-
151
-
152
-
153
-
154
-
155
-
156
-
157
-
158
-
159
-
160
-
161
-
162
-
163
-
164
-
165
-
166
-
167
-
168
 |
 |

Other operating charges in 2008 also included approximately $63 million of costs associated with contract
termination fees and approximately $38 million related to asset impairments. The contract termination fees were
primarily the result of penalties incurred by the Company to terminate existing supply and co-packer
agreements. Charges related to asset impairments were primarily due to the write-down of manufacturing lines
that produce product packaging materials. Refer to Note 19 of Notes to Consolidated Financial Statements.
In 2007, the Company incurred other operating charges of approximately $254 million, primarily related to
restructuring costs and asset impairments. These restructuring costs and asset impairments included the
reorganization of the North American business around three main business units: Sparkling Beverages, Still
Beverages and Emerging Brands. They also included the plan to close a beverage concentrate manufacturing
and distribution plant in Drogheda, Ireland, as well as individually insignificant streamlining activities
throughout many other business units. Refer to Note 18 of Notes to Consolidated Financial Statements. Also in
2007, other operating charges included charges related to asset impairments, none of which was individually
significant.
During 2006, our Company recorded other operating charges of $185 million. Of these charges,
approximately $108 million were primarily related to the impairment of assets and investments in our bottling
operations, approximately $53 million were the result of contract termination fees related to production capacity
efficiencies and approximately $24 million were related to other restructuring costs. None of these charges was
individually significant. The impairment charges were primarily the result of a revised outlook for certain assets
and bottling operations in Asia, which had been impacted by unfavorable market conditions and declines in
volume. Refer to the discussion under ‘‘Critical Accounting Policies and Estimates—Goodwill, Trademarks and
Other Intangible Assets,’’ and Note 19 of Notes to Consolidated Financial Statements.
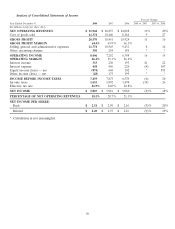
Operating Income and Operating Margin
Information about our operating income contribution by operating segment on a percentage basis is as
follows:
Year Ended December 31, 2008 2007 2006
Eurasia & Africa 9.9% 9.2% 9.3%
Europe 37.6 38.3 37.4
Latin America 24.8 24.1 22.8
North America 18.8 23.4 26.7
Pacific 22.0 23.4 26.2
Bottling Investments 3.1 2.1 0.3
Corporate (16.2) (20.5) (22.7)
100.0% 100.0% 100.0%
Information about our operating margin on a consolidated basis and by operating segment is as follows:
Year Ended December 31, 2008 2007 2006
Consolidated 26.4% 25.1% 26.2%
Eurasia & Africa 39.1% 34.4% 35.2%
Europe 66.4 62.4 60.9
Latin America 57.9 57.0 57.9
North America 19.3 21.9 24.0
Pacific 42.6 42.5 41.4
Bottling Investments 3.0 2.0 0.4
Corporate ***
* Calculation is not meaningful.
55