Coca Cola 2008 Annual Report Download - page 52
Download and view the complete annual report
Please find page 52 of the 2008 Coca Cola annual report below. You can navigate through the pages in the report by either clicking on the pages listed below, or by using the keyword search tool below to find specific information within the annual report.-
 1
1 -
2
-
3
-
4
-
5
-
6
-
7
-
8
-
9
-
10
-
11
-
12
-
13
-
14
-
15
-
16
-
17
-
18
-
19
-
20
-
21
-
22
-
23
-
24
-
25
-
26
-
27
-
28
-
29
-
30
-
31
-
32
-
33
-
34
-
35
-
36
-
37
-
38
-
39
-
40
-
41
-
 42
42 -
 43
43 -
 44
44 -
 45
45 -
 46
46 -
 47
47 -
 48
48 -
 49
49 -
 50
50 -
 51
51 -
 52
52 -
 53
53 -
 54
54 -
 55
55 -
 56
56 -
 57
57 -
 58
58 -
 59
59 -
 60
60 -
 61
61 -
 62
62 -
63
-
64
-
65
-
66
-
67
-
68
-
69
-
70
-
71
-
72
-
73
-
74
-
75
-
76
-
77
-
78
-
79
-
80
-
81
-
82
-
83
-
84
-
85
-
86
-
87
-
88
-
89
-
90
-
91
-
92
-
93
-
94
-
95
-
96
-
97
-
98
-
99
-
100
-
101
-
102
-
103
-
104
-
105
-
106
-
107
-
108
-
109
-
110
-
111
-
112
-
113
-
114
-
115
-
116
-
117
-
118
-
119
-
120
-
121
-
122
-
123
-
124
-
125
-
126
-
127
-
128
-
129
-
130
-
131
-
132
-
133
-
134
-
135
-
136
-
137
-
138
-
139
-
140
-
141
-
142
-
143
-
144
-
145
-
146
-
147
-
148
-
149
-
150
-
151
-
152
-
153
-
154
-
155
-
156
-
157
-
158
-
159
-
160
-
161
-
162
-
163
-
164
-
165
-
166
-
167
-
168
 |
 |

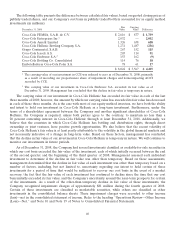
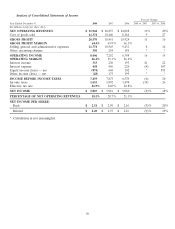
Analysis of Consolidated Statements of Income
Percent Change
Year Ended December 31, 2008 2007 2006 2008 vs. 2007 2007 vs. 2006
(In millions except per share data)
NET OPERATING REVENUES $ 31,944 $ 28,857 $ 24,088 11% 20%
Cost of goods sold 11,374 10,406 8,164 9 27
GROSS PROFIT 20,570 18,451 15,924 11 16
GROSS PROFIT MARGIN 64.4% 63.9% 66.1%
Selling, general and administrative expenses 11,774 10,945 9,431 8 16
Other operating charges 350 254 185 * *
OPERATING INCOME 8,446 7,252 6,308 16 15
OPERATING MARGIN 26.4% 25.1% 26.2%
Interest income 333 236 193 41 22
Interest expense 438 456 220 (4) 107
Equity income (loss) — net (874) 668 102 * 555
Other income (loss) — net (28) 173 195 * *
INCOME BEFORE INCOME TAXES 7,439 7,873 6,578 (6) 20
Income taxes 1,632 1,892 1,498 (14) 26
Effective tax rate 21.9% 24.0% 22.8%
NET INCOME $ 5,807 $ 5,981 $ 5,080 (3)% 18%
PERCENTAGE OF NET OPERATING REVENUES 18.2% 20.7% 21.1%
NET INCOME PER SHARE:
Basic $ 2.51 $ 2.59 $ 2.16 (3)% 20%
Diluted $ 2.49 $ 2.57 $ 2.16 (3)% 19%
* Calculation is not meaningful.
50