Coca Cola 2008 Annual Report Download - page 119
Download and view the complete annual report
Please find page 119 of the 2008 Coca Cola annual report below. You can navigate through the pages in the report by either clicking on the pages listed below, or by using the keyword search tool below to find specific information within the annual report.-
 1
1 -
2
-
3
-
4
-
5
-
6
-
7
-
8
-
9
-
10
-
11
-
12
-
13
-
14
-
15
-
16
-
17
-
18
-
19
-
20
-
21
-
22
-
23
-
24
-
25
-
26
-
27
-
28
-
29
-
30
-
31
-
32
-
33
-
34
-
35
-
36
-
37
-
38
-
39
-
40
-
41
-
42
-
43
-
44
-
45
-
46
-
47
-
48
-
49
-
50
-
51
-
52
-
53
-
54
-
55
-
56
-
57
-
58
-
59
-
60
-
61
-
62
-
63
-
64
-
65
-
66
-
67
-
68
-
69
-
70
-
71
-
72
-
73
-
74
-
75
-
76
-
77
-
78
-
79
-
80
-
81
-
82
-
83
-
84
-
85
-
86
-
87
-
88
-
89
-
90
-
91
-
92
-
93
-
94
-
95
-
96
-
97
-
98
-
99
-
100
-
101
-
102
-
103
-
104
-
105
-
106
-
107
-
108
-
 109
109 -
 110
110 -
 111
111 -
 112
112 -
 113
113 -
 114
114 -
 115
115 -
 116
116 -
 117
117 -
 118
118 -
 119
119 -
 120
120 -
 121
121 -
 122
122 -
 123
123 -
 124
124 -
 125
125 -
 126
126 -
 127
127 -
 128
128 -
 129
129 -
130
-
131
-
132
-
133
-
134
-
135
-
136
-
137
-
138
-
139
-
140
-
141
-
142
-
143
-
144
-
145
-
146
-
147
-
148
-
149
-
150
-
151
-
152
-
153
-
154
-
155
-
156
-
157
-
158
-
159
-
160
-
161
-
162
-
163
-
164
-
165
-
166
-
167
-
168
 |
 |
THE COCA-COLA COMPANY AND SUBSIDIARIES
NOTES TO CONSOLIDATED FINANCIAL STATEMENTS
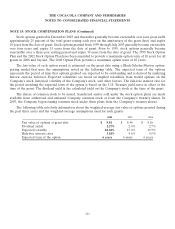
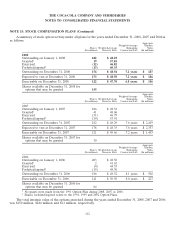
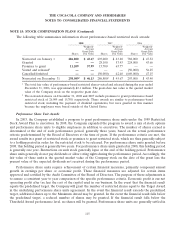
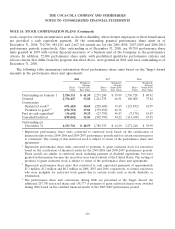
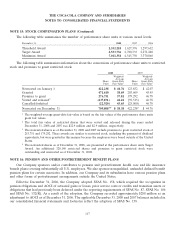
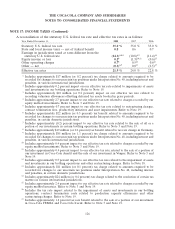
NOTE 15: STOCK COMPENSATION PLANS (Continued)
The following table summarizes the number of performance share units at various award levels:
December 31, 2008 2007 2006
Threshold Award 2,352,218 1,627,376 1,297,632
Target Award 4,533,736 2,780,333 2,271,240
Maximum Award 7,011,354 4,545,750 3,370,860
The following table summarizes information about the conversions of performance share units to restricted
stock and promises to grant restricted stock:
2008 2007
Weighted- Weighted-
Average Average
Share Grant-Date Share Grant-Date
Units Fair Value1Units Fair Value1
Nonvested on January 1 422,238 $ 44.76 123,852 $ 42.07
Granted 471,610 38.69 203,609 45.45
Promises to grant 276,751 37.81 179,292 46.78
Vested and released2(437,871) 44.22 (59,515) 46.78
Cancelled/forfeited (22,920) 43.65 (25,000) 46.78
Nonvested on December 31 709,8083,4 $ 38.38 422,2383$ 44.76
1The weighted-average grant-date fair value is based on the fair values of the performance share units
grant fair values.
2The total fair value of restricted shares that were vested and released during the years ended
December 31, 2008 and 2007 was $22.9 million and $2.9 million, respectively.
3The nonvested shares as of December 31, 2008 and 2007 include promises to grant restricted stock of
253,751 and 179,292. These awards are similar to restricted stock, including the payment of dividend
equivalents, but were granted in this manner because the employees were based outside of the United
States.
4The nonvested shares as of December 31, 2008, are presented at the performance share units Target
Award. An additional 320,140 restricted shares and promises to grant restricted stock were
outstanding and nonvested as of December 31, 2008.
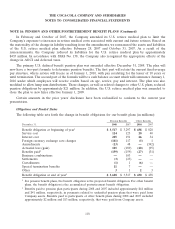
NOTE 16: PENSION AND OTHER POSTRETIREMENT BENEFIT PLANS
Our Company sponsors and/or contributes to pension and postretirement health care and life insurance
benefit plans covering substantially all U.S. employees. We also sponsor nonqualified, unfunded defined benefit
pension plans for certain associates. In addition, our Company and its subsidiaries have various pension plans
and other forms of postretirement arrangements outside the United States.
Effective December 31, 2006, the Company adopted SFAS No. 158, which required the recognition in
pension obligations and AOCI of actuarial gains or losses, prior service costs or credits and transition assets or
obligations that had previously been deferred under the reporting requirements of SFAS No. 87, SFAS No. 106
and SFAS No. 132(R). As a result of the adoption, the Company recorded approximately $288 million as an
adjustment to AOCI as of December 31, 2006. The applicable December 31, 2008 and 2007 balances included in
our consolidated financial statements and footnotes reflect the adoption of SFAS No. 158.
117