Coca Cola 2008 Annual Report Download - page 55
Download and view the complete annual report
Please find page 55 of the 2008 Coca Cola annual report below. You can navigate through the pages in the report by either clicking on the pages listed below, or by using the keyword search tool below to find specific information within the annual report.-
 1
1 -
2
-
3
-
4
-
5
-
6
-
7
-
8
-
9
-
10
-
11
-
12
-
13
-
14
-
15
-
16
-
17
-
18
-
19
-
20
-
21
-
22
-
23
-
24
-
25
-
26
-
27
-
28
-
29
-
30
-
31
-
32
-
33
-
34
-
35
-
36
-
37
-
38
-
39
-
40
-
41
-
42
-
43
-
44
-
 45
45 -
 46
46 -
 47
47 -
 48
48 -
 49
49 -
 50
50 -
 51
51 -
 52
52 -
 53
53 -
 54
54 -
 55
55 -
 56
56 -
 57
57 -
 58
58 -
 59
59 -
 60
60 -
 61
61 -
 62
62 -
 63
63 -
 64
64 -
 65
65 -
66
-
67
-
68
-
69
-
70
-
71
-
72
-
73
-
74
-
75
-
76
-
77
-
78
-
79
-
80
-
81
-
82
-
83
-
84
-
85
-
86
-
87
-
88
-
89
-
90
-
91
-
92
-
93
-
94
-
95
-
96
-
97
-
98
-
99
-
100
-
101
-
102
-
103
-
104
-
105
-
106
-
107
-
108
-
109
-
110
-
111
-
112
-
113
-
114
-
115
-
116
-
117
-
118
-
119
-
120
-
121
-
122
-
123
-
124
-
125
-
126
-
127
-
128
-
129
-
130
-
131
-
132
-
133
-
134
-
135
-
136
-
137
-
138
-
139
-
140
-
141
-
142
-
143
-
144
-
145
-
146
-
147
-
148
-
149
-
150
-
151
-
152
-
153
-
154
-
155
-
156
-
157
-
158
-
159
-
160
-
161
-
162
-
163
-
164
-
165
-
166
-
167
-
168
 |
 |

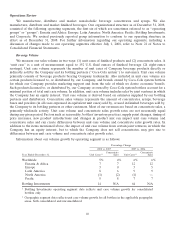
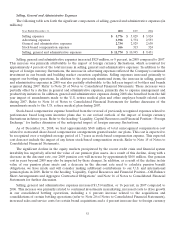
Selling, General and Administrative Expenses
The following table sets forth the significant components of selling, general and administrative expenses (in
millions):
Year Ended December 31, 2008 2007 2006
Selling expenses $ 5,776 $ 5,029 $ 3,924
Advertising expenses 2,998 2,774 2,553
General and administrative expenses 2,734 2,829 2,630
Stock-based compensation expense 266 313 324
Selling, general and administrative expenses $ 11,774 $ 10,945 $ 9,431
Selling, general and administrative expenses increased $829 million, or 8 percent, in 2008 compared to 2007.
This increase was primarily attributable to the impact of foreign currency fluctuations, which accounted for
approximately 4 percent of the total increase in selling, general and administrative expenses. In addition to the
impact of foreign currency fluctuations, the increase in advertising expenses reflected the Company’s continued
investment in our brands and building market execution capabilities. Selling expenses increased primarily to
support our bottling operations. In addition to the previously mentioned items, the increase in selling, general
and administrative expenses in 2008 was also partially attributable to the full year impact of bottlers and brands
acquired during 2007. Refer to Note 20 of Notes to Consolidated Financial Statements. These increases were
partially offset by a decline in general and administrative expenses, primarily due to expense management and
productivity initiatives. In addition, general and administrative expenses during 2008 also benefited from the full
year impact of amendments made to the U.S. retiree medical plan and other employee benefit related costs
during 2007. Refer to Note 16 of Notes to Consolidated Financial Statements for further discussion of the
amendments made to the U.S. retiree medical plan during 2007.
Stock-based compensation expense benefited from the reversal of previously recognized expenses related to
performance based long-term incentive plans due to our revised outlook of the impact of foreign currency
fluctuations in future years. Refer to the heading ‘‘Liquidity, Capital Resources and Financial Position—Foreign
Exchange’’ for further discussion of the anticipated impact of foreign currency fluctuations.
As of December 31, 2008, we had approximately $368 million of total unrecognized compensation cost
related to nonvested share-based compensation arrangements granted under our plans. This cost is expected to
be recognized over a weighted-average period of 1.7 years as stock-based compensation expense. This expected
cost does not include the impact of any future stock-based compensation awards. Refer to Note 15 of Notes to
Consolidated Financial Statements.
The significant decline in the equity markets precipitated by the recent credit crisis and financial system
instability has negatively affected the value of our pension plan assets. As a result of this decline, along with a
decrease in the discount rate, our 2009 pension cost will increase by approximately $100 million. Our pension
cost in years beyond 2009 may also be impacted by these changes. In addition, as a result of the decline in fair
value of our pension plans assets and a decrease in the discount rate used to calculate pension benefit
obligations, we have made and will consider making additional contributions to our U.S. and international
pension plans in 2009. Refer to the heading ‘‘Liquidity, Capital Resources and Financial Position—Off-Balance
Sheet Arrangements and Aggregate Contractual Obligations’’ and Note 16 of Notes to Consolidated Financial
Statements for further discussion.
Selling, general and administrative expenses increased $1,514 million, or 16 percent, in 2007 compared to
2006. This increase was primarily related to continued investments in marketing, increased costs to drive growth
in our consolidated bottling operations, including a 6 percent increase related to the acquisitions and
consolidations of certain bottling operations (refer to Note 20 of Notes to Consolidated Financial Statements),
increased sales and service costs for certain brand acquisitions and a 4 percent increase due to foreign currency
53