Coca Cola 2008 Annual Report Download - page 56
Download and view the complete annual report
Please find page 56 of the 2008 Coca Cola annual report below. You can navigate through the pages in the report by either clicking on the pages listed below, or by using the keyword search tool below to find specific information within the annual report.-
 1
1 -
2
-
3
-
4
-
5
-
6
-
7
-
8
-
9
-
10
-
11
-
12
-
13
-
14
-
15
-
16
-
17
-
18
-
19
-
20
-
21
-
22
-
23
-
24
-
25
-
26
-
27
-
28
-
29
-
30
-
31
-
32
-
33
-
34
-
35
-
36
-
37
-
38
-
39
-
40
-
41
-
42
-
43
-
44
-
45
-
 46
46 -
 47
47 -
 48
48 -
 49
49 -
 50
50 -
 51
51 -
 52
52 -
 53
53 -
 54
54 -
 55
55 -
 56
56 -
 57
57 -
 58
58 -
 59
59 -
 60
60 -
 61
61 -
 62
62 -
 63
63 -
 64
64 -
 65
65 -
 66
66 -
67
-
68
-
69
-
70
-
71
-
72
-
73
-
74
-
75
-
76
-
77
-
78
-
79
-
80
-
81
-
82
-
83
-
84
-
85
-
86
-
87
-
88
-
89
-
90
-
91
-
92
-
93
-
94
-
95
-
96
-
97
-
98
-
99
-
100
-
101
-
102
-
103
-
104
-
105
-
106
-
107
-
108
-
109
-
110
-
111
-
112
-
113
-
114
-
115
-
116
-
117
-
118
-
119
-
120
-
121
-
122
-
123
-
124
-
125
-
126
-
127
-
128
-
129
-
130
-
131
-
132
-
133
-
134
-
135
-
136
-
137
-
138
-
139
-
140
-
141
-
142
-
143
-
144
-
145
-
146
-
147
-
148
-
149
-
150
-
151
-
152
-
153
-
154
-
155
-
156
-
157
-
158
-
159
-
160
-
161
-
162
-
163
-
164
-
165
-
166
-
167
-
168
 |
 |

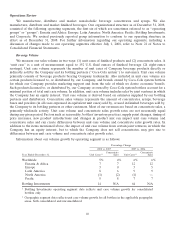
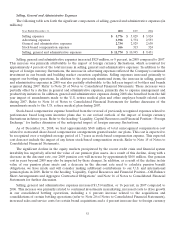
fluctuations. Selling and advertising expenses increased 20 percent in 2007 compared to 2006, on a combined
basis. The increases in selling and advertising expenses were primarily related to increased investments in
marketing and innovation activities, including the reinvestment of certain general and administrative expense
savings derived from productivity initiatives. Selling and advertising expenses also increased due to costs to drive
growth in our consolidated bottling operations, including a 6 percent increase related to the acquisitions and
consolidations of certain bottling operations and a 4 percent increase due to foreign currency fluctuations.
General and administrative expenses increased 8 percent in 2007, primarily due to increased costs in our
consolidated bottling operations, including a 4 percent impact relating to the acquisitions and consolidations of
certain bottling operations, increased costs related to our short-term incentive plan based on the Company’s
financial performance, and a 3 percent increase due to foreign currency fluctuations. These increases in general
and administrative expenses were partially offset by expense savings generated through productivity initiatives
and a decrease of approximately $82 million in our annual net periodic benefits costs, primarily due to the
impact of amendments made to the U.S. retiree medical plan during 2007. Refer to Note 16 of Notes to
Consolidated Financial Statements for further discussion of the amendments made to the U.S. retiree medical
plan during 2007.
Other Operating Charges
The other operating charges incurred by operating segment were as follows (in millions):
Year Ended December 31, 2008 2007 2006
Eurasia & Africa $1$37 $ 3
Europe —33 36
Latin America 14—
North America 56 23 —
Pacific —362
Bottling Investments 46 33 83
Corporate 246 121 1
Total $ 350 $ 254 $ 185
During 2008, the Company incurred other operating charges of approximately $350 million, consisting of
restructuring charges, contract termination fees, expenses related to productivity initiatives and asset
impairments.
The Company incurred restructuring costs of approximately $194 million during 2008. These costs were
primarily related to steps the Company took in 2007 to streamline and simplify its operations globally, which
included the closing of a beverage concentrate manufacturing and distribution plant in Drogheda, Ireland, as
well as streamlining activities in other selected business units. The Company has incurred total pretax expenses
of approximately $410 million related to these restructuring activities since they commenced. The Company does
not anticipate recognizing any additional significant expenses as part of this plan. The expected payback period
for this plan is three to four years. Refer to Note 18 of Notes to Consolidated Financial Statements.
The Company incurred total pretax expenses of approximately $55 million related to productivity initiatives
since they commenced in the first quarter of 2008. The Company is targeting $500 million in annualized savings
from productivity initiatives by the end of 2011 to provide additional flexibility to invest for growth. The savings
are expected to be generated in a number of areas, and include aggressively managing operating expenses
supported by lean techniques; redesigning key processes to drive standardization and effectiveness; better
leveraging our size and scale; and driving savings in indirect costs through the implementation of a
‘‘procure-to-pay’’ program. In realizing these savings, the Company expects to incur total costs of approximately
$500 million by the end of 2011. Refer to Note 18 of Notes to Consolidated Financial Statements.
54