Coca Cola 2008 Annual Report Download - page 54
Download and view the complete annual report
Please find page 54 of the 2008 Coca Cola annual report below. You can navigate through the pages in the report by either clicking on the pages listed below, or by using the keyword search tool below to find specific information within the annual report.-
 1
1 -
2
-
3
-
4
-
5
-
6
-
7
-
8
-
9
-
10
-
11
-
12
-
13
-
14
-
15
-
16
-
17
-
18
-
19
-
20
-
21
-
22
-
23
-
24
-
25
-
26
-
27
-
28
-
29
-
30
-
31
-
32
-
33
-
34
-
35
-
36
-
37
-
38
-
39
-
40
-
41
-
42
-
43
-
 44
44 -
 45
45 -
 46
46 -
 47
47 -
 48
48 -
 49
49 -
 50
50 -
 51
51 -
 52
52 -
 53
53 -
 54
54 -
 55
55 -
 56
56 -
 57
57 -
 58
58 -
 59
59 -
 60
60 -
 61
61 -
 62
62 -
 63
63 -
 64
64 -
65
-
66
-
67
-
68
-
69
-
70
-
71
-
72
-
73
-
74
-
75
-
76
-
77
-
78
-
79
-
80
-
81
-
82
-
83
-
84
-
85
-
86
-
87
-
88
-
89
-
90
-
91
-
92
-
93
-
94
-
95
-
96
-
97
-
98
-
99
-
100
-
101
-
102
-
103
-
104
-
105
-
106
-
107
-
108
-
109
-
110
-
111
-
112
-
113
-
114
-
115
-
116
-
117
-
118
-
119
-
120
-
121
-
122
-
123
-
124
-
125
-
126
-
127
-
128
-
129
-
130
-
131
-
132
-
133
-
134
-
135
-
136
-
137
-
138
-
139
-
140
-
141
-
142
-
143
-
144
-
145
-
146
-
147
-
148
-
149
-
150
-
151
-
152
-
153
-
154
-
155
-
156
-
157
-
158
-
159
-
160
-
161
-
162
-
163
-
164
-
165
-
166
-
167
-
168
 |
 |

strengthening against the Japanese yen and South African rand, which unfavorably impacted the Pacific, Eurasia
and Africa and Bottling Investments operating segments. Refer to the heading ‘‘Liquidity, Capital Resources
and Financial Position—Foreign Exchange.’’
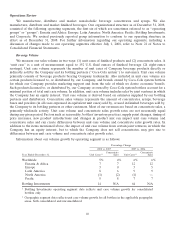
Information about our net operating revenues by operating segment as a percentage of Company net
operating revenues is as follows:
Year Ended December 31, 2008 2007 2006
Eurasia & Africa 6.7% 6.8% 7.0%
Europe 15.0 15.4 16.1
Latin America 11.3 10.6 10.3
North America 25.7 26.9 29.1
Pacific 13.7 13.9 16.5
Bottling Investments 27.3 26.2 20.6
Corporate 0.3 0.2 0.4
100.0% 100.0% 100.0%
The percentage contribution of each operating segment has changed due to net operating revenues in
certain operating segments growing at a faster rate compared to the other operating segments. Net operating
revenue growth rates are impacted by concentrate sales volume growth rates, structural changes, price and
product/geographic mix and foreign currency fluctuations.
The size and timing of structural changes, including acquisitions or dispositions of bottling and canning
operations, do not occur consistently from period to period. As a result, anticipating the impact of such events
on future increases or decreases in net operating revenues (and other financial statement line items) usually is
not possible. However, we expect to continue to buy and sell bottling interests in limited circumstances and, as a
result, structural changes will continue to affect our consolidated financial statements in future periods.
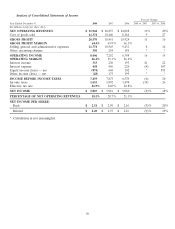
Gross Profit
Our gross profit margin increased to 64.4 percent in 2008 from 63.9 percent in 2007. The increase in our
gross profit margin was primarily attributable to favorable price and product mix across the majority of
our operating segments, as well as the favorable impact of the sale of Remil and the sale of a portion of our
ownership interest in Coca-Cola Pakistan, which resulted in its deconsolidation. Refer to Note 19 of Notes to
Consolidated Financial Statements. Generally, bottling and finished product operations produce higher net
revenues but lower gross profit margins compared to concentrate and syrup operations. The favorable impact of
the previously mentioned items was partially offset by the full year impact of 2007 acquisitions, including, but not
limited to, 18 German bottling and distribution operations, NORSA, glac´
eau, CCBPI and Leao Junior. Refer to
Note 20 of Notes to Consolidated Financial Statements. In addition to the full year impact of prior year
acquisitions, our 2008 gross profit margin was also unfavorably impacted by increases in the cost of raw materials
and freight.
Our gross profit margin decreased to 63.9 percent in 2007 from 66.1 percent in 2006. The decrease in our
gross profit margin in 2007 was primarily due to the partial year impact of acquisitions made during 2007,
including, but not limited to, 18 German bottling and distribution operations, NORSA, glac´
eau, CCBPI and
Leao Junior. In addition to the partial year impact of 2007 acquisitions, the full year impact of the acquisition of
CCCIL and the consolidation of Brucephil during 2006 also contributed to the decline in our 2007 gross profit
margin. Refer to Note 20 of Notes to Consolidated Financial Statements. Our 2007 gross profit margin was also
unfavorably impacted by increases in the cost of raw materials and freight.
52