Coca Cola 2008 Annual Report Download - page 58
Download and view the complete annual report
Please find page 58 of the 2008 Coca Cola annual report below. You can navigate through the pages in the report by either clicking on the pages listed below, or by using the keyword search tool below to find specific information within the annual report.-
 1
1 -
2
-
3
-
4
-
5
-
6
-
7
-
8
-
9
-
10
-
11
-
12
-
13
-
14
-
15
-
16
-
17
-
18
-
19
-
20
-
21
-
22
-
23
-
24
-
25
-
26
-
27
-
28
-
29
-
30
-
31
-
32
-
33
-
34
-
35
-
36
-
37
-
38
-
39
-
40
-
41
-
42
-
43
-
44
-
45
-
46
-
47
-
 48
48 -
 49
49 -
 50
50 -
 51
51 -
 52
52 -
 53
53 -
 54
54 -
 55
55 -
 56
56 -
 57
57 -
 58
58 -
 59
59 -
 60
60 -
 61
61 -
 62
62 -
 63
63 -
 64
64 -
 65
65 -
 66
66 -
 67
67 -
 68
68 -
69
-
70
-
71
-
72
-
73
-
74
-
75
-
76
-
77
-
78
-
79
-
80
-
81
-
82
-
83
-
84
-
85
-
86
-
87
-
88
-
89
-
90
-
91
-
92
-
93
-
94
-
95
-
96
-
97
-
98
-
99
-
100
-
101
-
102
-
103
-
104
-
105
-
106
-
107
-
108
-
109
-
110
-
111
-
112
-
113
-
114
-
115
-
116
-
117
-
118
-
119
-
120
-
121
-
122
-
123
-
124
-
125
-
126
-
127
-
128
-
129
-
130
-
131
-
132
-
133
-
134
-
135
-
136
-
137
-
138
-
139
-
140
-
141
-
142
-
143
-
144
-
145
-
146
-
147
-
148
-
149
-
150
-
151
-
152
-
153
-
154
-
155
-
156
-
157
-
158
-
159
-
160
-
161
-
162
-
163
-
164
-
165
-
166
-
167
-
168
 |
 |
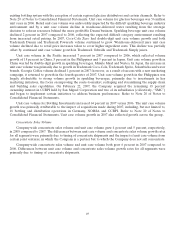
As demonstrated by the tables above, the percentage contribution to operating income and operating
margin by each operating segment fluctuated from year to year. Operating income and operating margin by
operating segment were influenced by a variety of factors and events including the following:
• In 2008, foreign currency exchange rates favorably impacted operating income by approximately
6 percent, primarily due to a weaker U.S. dollar compared to the euro, Japanese yen and Brazilian real,
which had a favorable impact on the Europe, Pacific, Latin America and Bottling Investments operating
segments. The favorable impact of a weaker U.S. dollar compared to the aforementioned currencies was
partially offset by the impact of a stronger U.S. dollar compared to the South African rand and the
British pound, which had an unfavorable impact on the Eurasia and Africa, Europe and Bottling
Investments operating segments. Refer to the heading ‘‘Liquidity, Capital Resources and Financial
Position—Foreign Exchange.’’
• In 2008, price increases across the majority of operating segments had a favorable impact on both
operating income and operating margins.
• In 2008, increased spending on marketing and innovation activities impacted the majority of the
operating segments’ operating income and operating margins. Refer to the heading ‘‘Selling, General and
Administrative Expenses,’’ above.
• In 2008, increases in the cost of raw materials and product mix, primarily as a result of finished goods
businesses, adversely impacted North America’s operating income and operating margin.
• In 2008, our operating margin was unfavorably impacted by the full year impact of acquisitions made
during 2007, including, but not limited to, 18 German bottling and distribution operations, NORSA,
glac´
eau, CCBPI and Leao Junior. Refer to the heading ‘‘Gross Profit,’’ above. These acquisitions
impacted the Latin America, North America and Bottling Investments operating segments.
• In 2008, operating income was reduced by approximately $1 million for Eurasia and Africa, $1 million for
Latin America, $56 million for North America, $46 million for Bottling Investments and $246 million for
Corporate, primarily due to restructuring costs, contract termination fees, productivity initiatives and
asset impairments. Refer to the heading ‘‘Other Operating Charges,’’ above.
• In 2007, foreign currency exchange rates favorably impacted operating income by approximately
4 percent, primarily related to a weaker U.S. dollar compared to the euro, Brazilian real and Australian
dollar, which had a favorable impact on the Europe, Latin America and Bottling Investments operating
segments. The favorable impact of a weaker U.S. dollar compared to the aforementioned currencies was
partially offset by the impact of a stronger U.S. dollar compared to the Japanese yen and South African
rand, which had an unfavorable impact on the Eurasia and Africa, Pacific and Bottling Investments
operating segments. Refer to the heading ‘‘Liquidity, Capital Resources and Financial Position—Foreign
Exchange.’’
• In 2007, price increases across the majority of operating segments had a favorable impact on both
operating income and operating margins.
• In 2007, increased spending on marketing and innovation activities impacted the majority of the
operating segments’ operating income. Refer to the heading ‘‘Selling, General and Administrative
Expenses,’’ above.
• In 2007, operating income was reduced by approximately $37 million for Eurasia and Africa, $33 million
for Europe, $4 million for Latin America, $23 million for North America, $3 million for Pacific,
$47 million for Bottling Investments and $121 million for Corporate, primarily due to restructuring costs
and asset impairments, included in other operating charges and cost of goods sold. Refer to the heading
‘‘Other Operating Charges,’’ above.
56