Coca Cola 2008 Annual Report Download - page 65
Download and view the complete annual report
Please find page 65 of the 2008 Coca Cola annual report below. You can navigate through the pages in the report by either clicking on the pages listed below, or by using the keyword search tool below to find specific information within the annual report.-
 1
1 -
2
-
3
-
4
-
5
-
6
-
7
-
8
-
9
-
10
-
11
-
12
-
13
-
14
-
15
-
16
-
17
-
18
-
19
-
20
-
21
-
22
-
23
-
24
-
25
-
26
-
27
-
28
-
29
-
30
-
31
-
32
-
33
-
34
-
35
-
36
-
37
-
38
-
39
-
40
-
41
-
42
-
43
-
44
-
45
-
46
-
47
-
48
-
49
-
50
-
51
-
52
-
53
-
54
-
 55
55 -
 56
56 -
 57
57 -
 58
58 -
 59
59 -
 60
60 -
 61
61 -
 62
62 -
 63
63 -
 64
64 -
 65
65 -
 66
66 -
 67
67 -
 68
68 -
 69
69 -
 70
70 -
 71
71 -
 72
72 -
 73
73 -
 74
74 -
 75
75 -
76
-
77
-
78
-
79
-
80
-
81
-
82
-
83
-
84
-
85
-
86
-
87
-
88
-
89
-
90
-
91
-
92
-
93
-
94
-
95
-
96
-
97
-
98
-
99
-
100
-
101
-
102
-
103
-
104
-
105
-
106
-
107
-
108
-
109
-
110
-
111
-
112
-
113
-
114
-
115
-
116
-
117
-
118
-
119
-
120
-
121
-
122
-
123
-
124
-
125
-
126
-
127
-
128
-
129
-
130
-
131
-
132
-
133
-
134
-
135
-
136
-
137
-
138
-
139
-
140
-
141
-
142
-
143
-
144
-
145
-
146
-
147
-
148
-
149
-
150
-
151
-
152
-
153
-
154
-
155
-
156
-
157
-
158
-
159
-
160
-
161
-
162
-
163
-
164
-
165
-
166
-
167
-
168
 |
 |

65 percent of the shares of capital stock of CCBPI not previously owned by our Company. In addition, the
Company acquired a 50 percent interest in Jugos del Valle, a 34 percent interest in Tokyo Coca-Cola Bottling
Company (‘‘Tokyo CCBC’’) and an 11 percent interest in NORSA. Refer to Note 20 of Notes to Consolidated
Financial Statements. The remaining amount of cash used for acquisitions and investments was primarily related
to the acquisition of various trademarks and brands, none of which was individually significant.
Investing activities in 2007 also included proceeds of approximately $238 million received from the sale of
our 49 percent equity interest in Vonpar, approximately $143 million received from the sale of a portion of our
interest in Coca-Cola Amatil, and approximately $106 million in proceeds from the sale of real estate in Spain
and in the United States. Refer to Note 19 of Notes to Consolidated Financial Statements.
In 2006, our Company acquired a controlling interest in CCCIL and acquired Apollinaris and TJC Holdings
(Pty) Ltd., a South African bottling company (‘‘TJC’’). Refer to Note 20 of Notes to Consolidated Financial
Statements. The remaining amount of cash used for acquisitions and investments was primarily related to the
acquisition of various trademarks and brands, none of which was individually significant.
Investing activities in 2006 also included proceeds of approximately $198 million received from the sale of
shares in connection with the initial public offering of Coca-Cola Icecek and proceeds of approximately
$427 million received from the sale of a portion of Coca-Cola FEMSA shares to FEMSA. Refer to Note 3 of
Notes to Consolidated Financial Statements.
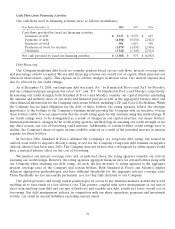
Net purchases of property, plant and equipment for the years ended December 31, 2008, 2007 and 2006
were approximately $1,839 million, $1,409 million and $1,295 million, respectively. These increases were
primarily related to acquisitions of certain bottling operations in 2007 and 2006. Refer to Note 20 of Notes to
Consolidated Financial Statements. Generally, bottling and finished product operations are more capital
intensive compared to concentrate and syrup operations. Additionally, the impact of foreign currency
fluctuations during 2008 also contributed to the increase in reported purchases of property, plant and
equipment. Refer to the heading ‘‘Foreign Exchange,’’ below. Our Company currently estimates that net
purchases of property, plant and equipment in 2009 will be approximately $1.8 billion to $2.0 billion.
Total capital expenditures for property, plant and equipment (including our investments in information
technology) and the percentage of such totals by operating segment for 2008, 2007 and 2006 were as follows:
Year Ended December 31, 2008 2007 2006
Capital expenditures (in millions) $ 1,968 $ 1,648 $ 1,407
Eurasia & Africa 3.4% 4.5% 3.0%
Europe 3.9 4.8 6.7
Latin America 2.9 2.8 3.1
North America 25.0 20.9 29.9
Pacific 9.0 11.6 9.5
Bottling Investments 41.6 39.1 29.7
Corporate 14.2 16.3 18.1
63