Coca Cola 2008 Annual Report Download - page 109
Download and view the complete annual report
Please find page 109 of the 2008 Coca Cola annual report below. You can navigate through the pages in the report by either clicking on the pages listed below, or by using the keyword search tool below to find specific information within the annual report.-
 1
1 -
2
-
3
-
4
-
5
-
6
-
7
-
8
-
9
-
10
-
11
-
12
-
13
-
14
-
15
-
16
-
17
-
18
-
19
-
20
-
21
-
22
-
23
-
24
-
25
-
26
-
27
-
28
-
29
-
30
-
31
-
32
-
33
-
34
-
35
-
36
-
37
-
38
-
39
-
40
-
41
-
42
-
43
-
44
-
45
-
46
-
47
-
48
-
49
-
50
-
51
-
52
-
53
-
54
-
55
-
56
-
57
-
58
-
59
-
60
-
61
-
62
-
63
-
64
-
65
-
66
-
67
-
68
-
69
-
70
-
71
-
72
-
73
-
74
-
75
-
76
-
77
-
78
-
79
-
80
-
81
-
82
-
83
-
84
-
85
-
86
-
87
-
88
-
89
-
90
-
91
-
92
-
93
-
94
-
95
-
96
-
97
-
98
-
 99
99 -
 100
100 -
 101
101 -
 102
102 -
 103
103 -
 104
104 -
 105
105 -
 106
106 -
 107
107 -
 108
108 -
 109
109 -
 110
110 -
 111
111 -
 112
112 -
 113
113 -
 114
114 -
 115
115 -
 116
116 -
 117
117 -
 118
118 -
 119
119 -
120
-
121
-
122
-
123
-
124
-
125
-
126
-
127
-
128
-
129
-
130
-
131
-
132
-
133
-
134
-
135
-
136
-
137
-
138
-
139
-
140
-
141
-
142
-
143
-
144
-
145
-
146
-
147
-
148
-
149
-
150
-
151
-
152
-
153
-
154
-
155
-
156
-
157
-
158
-
159
-
160
-
161
-
162
-
163
-
164
-
165
-
166
-
167
-
168
 |
 |

THE COCA-COLA COMPANY AND SUBSIDIARIES
NOTES TO CONSOLIDATED FINANCIAL STATEMENTS
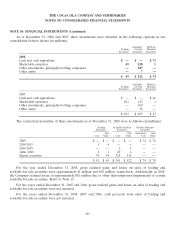
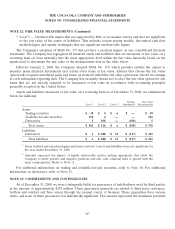
NOTE 12: FAIR VALUE MEASUREMENTS (Continued)
• Level 3 — Unobservable inputs that are supported by little or no market activity and that are significant
to the fair value of the assets or liabilities. This includes certain pricing models, discounted cash flow
methodologies and similar techniques that use significant unobservable inputs.
The Company’s adoption of SFAS No. 157 did not have a material impact on our consolidated financial
statements. The Company has segregated all financial assets and liabilities that are measured at fair value on a
recurring basis (at least annually) into the most appropriate level within the fair value hierarchy based on the
inputs used to determine the fair value at the measurement date in the table below.
Effective January 1, 2008, the Company adopted SFAS No. 159, which provides entities the option to
measure many financial instruments and certain other items at fair value. Entities that choose the fair value
option will recognize unrealized gains and losses on items for which the fair value option was elected in earnings
at each subsequent reporting date. The Company has currently chosen not to elect the fair value option for any
items that are not already required to be measured at fair value in accordance with accounting principles
generally accepted in the United States.
Assets and liabilities measured at fair value on a recurring basis as of December 31, 2008, are summarized
below (in millions):
Netting Fair Value
Level 1 Level 2 Level 31Adjustment2Measurements
Assets
Trading securities $39 $ 4 $ 6 $ — $49
Available-for-sale securities 518 4 — — 522
Derivatives 5 108 — (108) 5
Total assets $ 562 $ 116 $ 6 $ (108) $ 576
Liabilities
Derivatives $ 6 $ 288 $ 34 $ (117) $ 211
Total liabilities $ 6 $ 288 $ 34 $ (117) $ 211
1Gross realized and unrealized gains and losses on level 3 assets and liabilities were not significant for
the year ended December 31, 2008.
2Amounts represent the impact of legally enforceable master netting agreements that allow the
Company to settle positive and negative positions and also cash collateral held or placed with the
same counterparties. Refer to Note 11.
For additional information on trading and available-for-sale securities, refer to Note 10. For additional
information on derivatives, refer to Note 11.
NOTE 13: COMMITMENTS AND CONTINGENCIES
As of December 31, 2008, we were contingently liable for guarantees of indebtedness owed by third parties
in the amount of approximately $238 million. These guarantees primarily are related to third-party customers,
bottlers and vendors and have arisen through the normal course of business. These guarantees have various
terms, and none of these guarantees was individually significant. The amount represents the maximum potential
107