Coca Cola 2008 Annual Report Download - page 108
Download and view the complete annual report
Please find page 108 of the 2008 Coca Cola annual report below. You can navigate through the pages in the report by either clicking on the pages listed below, or by using the keyword search tool below to find specific information within the annual report.-
 1
1 -
2
-
3
-
4
-
5
-
6
-
7
-
8
-
9
-
10
-
11
-
12
-
13
-
14
-
15
-
16
-
17
-
18
-
19
-
20
-
21
-
22
-
23
-
24
-
25
-
26
-
27
-
28
-
29
-
30
-
31
-
32
-
33
-
34
-
35
-
36
-
37
-
38
-
39
-
40
-
41
-
42
-
43
-
44
-
45
-
46
-
47
-
48
-
49
-
50
-
51
-
52
-
53
-
54
-
55
-
56
-
57
-
58
-
59
-
60
-
61
-
62
-
63
-
64
-
65
-
66
-
67
-
68
-
69
-
70
-
71
-
72
-
73
-
74
-
75
-
76
-
77
-
78
-
79
-
80
-
81
-
82
-
83
-
84
-
85
-
86
-
87
-
88
-
89
-
90
-
91
-
92
-
93
-
94
-
95
-
96
-
97
-
 98
98 -
 99
99 -
 100
100 -
 101
101 -
 102
102 -
 103
103 -
 104
104 -
 105
105 -
 106
106 -
 107
107 -
 108
108 -
 109
109 -
 110
110 -
 111
111 -
 112
112 -
 113
113 -
 114
114 -
 115
115 -
 116
116 -
 117
117 -
 118
118 -
119
-
120
-
121
-
122
-
123
-
124
-
125
-
126
-
127
-
128
-
129
-
130
-
131
-
132
-
133
-
134
-
135
-
136
-
137
-
138
-
139
-
140
-
141
-
142
-
143
-
144
-
145
-
146
-
147
-
148
-
149
-
150
-
151
-
152
-
153
-
154
-
155
-
156
-
157
-
158
-
159
-
160
-
161
-
162
-
163
-
164
-
165
-
166
-
167
-
168
 |
 |

THE COCA-COLA COMPANY AND SUBSIDIARIES
NOTES TO CONSOLIDATED FINANCIAL STATEMENTS
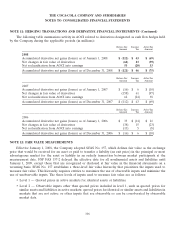
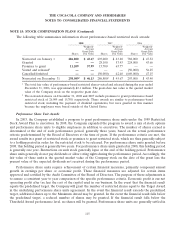
NOTE 11: HEDGING TRANSACTIONS AND DERIVATIVE FINANCIAL INSTRUMENTS (Continued)
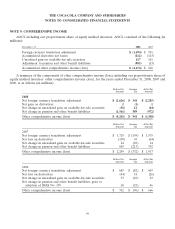
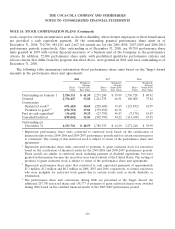
The following table summarizes activity in AOCI related to derivatives designated as cash flow hedges held
by the Company during the applicable periods (in millions):
Before-Tax Income After-Tax
Amount Tax Amount
2008
Accumulated derivative net gains (losses) as of January 1, 2008 $ (112) $ 43 $ (69)
Net changes in fair value of derivatives (62) 23 (39)
Net reclassification from AOCI into earnings 53 (20) 33
Accumulated derivative net gains (losses) as of December 31, 2008 $ (121) $ 46 $ (75)
Before-Tax Income After-Tax
Amount Tax Amount
2007
Accumulated derivative net gains (losses) as of January 1, 2007 $ (16) $ 6 $ (10)
Net changes in fair value of derivatives (158) 61 (97)
Net reclassification from AOCI into earnings 62 (24) 38
Accumulated derivative net gains (losses) as of December 31, 2007 $ (112) $ 43 $ (69)
Before-Tax Income After-Tax
Amount Tax Amount
2006
Accumulated derivative net gains (losses) as of January 1, 2006 $ 35 $ (14) $ 21
Net changes in fair value of derivatives (38) 15 (23)
Net reclassification from AOCI into earnings (13) 5 (8)
Accumulated derivative net gains (losses) as of December 31, 2006 $ (16) $ 6 $ (10)
NOTE 12: FAIR VALUE MEASUREMENTS
Effective January 1, 2008, the Company adopted SFAS No. 157, which defines fair value as the exchange
price that would be received for an asset or paid to transfer a liability (an exit price) in the principal or most
advantageous market for the asset or liability in an orderly transaction between market participants at the
measurement date. FSP FAS 157-2 delayed the effective date for all nonfinancial assets and liabilities until
January 1, 2009, except those that are recognized or disclosed at fair value in the financial statements on a
recurring basis. SFAS No. 157 establishes a three-level fair value hierarchy that prioritizes the inputs used to
measure fair value. This hierarchy requires entities to maximize the use of observable inputs and minimize the
use of unobservable inputs. The three levels of inputs used to measure fair value are as follows:
• Level 1 — Quoted prices in active markets for identical assets or liabilities.
• Level 2 — Observable inputs other than quoted prices included in level 1, such as quoted prices for
similar assets and liabilities in active markets; quoted prices for identical or similar assets and liabilities in
markets that are not active; or other inputs that are observable or can be corroborated by observable
market data.
106