Lowe's 2012 Annual Report Download - page 10
Download and view the complete annual report
Please find page 10 of the 2012 Lowe's annual report below. You can navigate through the pages in the report by either clicking on the pages listed below, or by using the keyword search tool below to find specific information within the annual report.-
 1
1 -
 2
2 -
 3
3 -
 4
4 -
 5
5 -
 6
6 -
 7
7 -
 8
8 -
 9
9 -
 10
10 -
 11
11 -
 12
12 -
 13
13 -
 14
14 -
 15
15 -
 16
16 -
 17
17 -
 18
18 -
 19
19 -
 20
20 -
 21
21 -
22
-
23
-
24
-
25
-
26
-
27
-
28
-
29
-
30
-
31
-
32
-
33
-
34
-
35
-
36
-
37
-
38
-
39
-
40
-
41
-
42
-
43
-
44
-
45
-
46
-
47
-
48
-
49
-
50
-
51
-
52
-
53
-
54
-
55
-
56
-
57
-
58
-
59
-
60
-
61
-
62
-
63
-
64
-
65
-
66
-
67
-
68
-
69
-
70
-
71
-
72
-
73
-
74
-
75
-
76
-
77
-
78
-
79
-
80
-
81
-
82
-
83
-
84
-
85
-
86
-
87
-
88
 |
 |
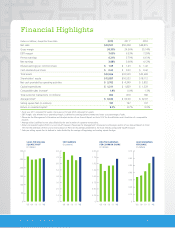
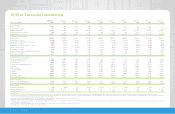
Dollars in Millions, Except Per Share Data 2012 2011
1
2010
Net sales $ 50,521 $ 50,208 $ 48,815
Gross margin 34.30% 34.56% 35.14%
EBIT margin
2
7.05% 6.53% 7.29%
Pre-tax earnings 6.21% 5.79% 6.61%
Net earnings 3.88% 3.66% 4.12%
Diluted earnings per common share $ 1.69 $ 1.43 $ 1.42
Cash dividends per share $ 0.62 $ 0.53 $ 0.42
Total assets $ 32,666 $ 33,559 $ 33,699
Shareholders’ equity $ 13,857 $ 16,533 $ 18,112
Net cash provided by operating activities $ 3,762 $ 4,349 $ 3,852
Capital expenditures $ 1,211 $ 1,829 $ 1,329
Comparable sales increase
3
1.4% 0.0% 1.3%
Total customer transactions (in millions) 804 810 786
Average ticket
4
$ 62.82 $ 62.00 $ 62.07
Selling square feet (in millions) 197 197 197
Return on invested capital
5
9.3% 8.7% 9.0%
1
Fiscal year 2011 contained 53 weeks. Fiscal years 2012 and 2010 contained 52 weeks.
2
EBIT margin, also referred to as operating margin, is defined as earnings before interest and taxes as a percentage of sales.
3
Please see the Management’s Discussion and Analysis section of our Annual Report on Form 10-K for the definition and calculation of a comparable
location.
4
Average ticket is defined as net sales divided by the total number of customer transactions.
5
Return on invested capital (ROIC) is a non-GAAP measure. Please see the Management’s Discussion and Analysis section of our Annual Report on Form
10-K for the definition of ROIC and a reconciliation of ROIC for the periods presented to the most directly comparable GAAP measure.
6
Sales per selling square foot is defined as sales divided by the average of beginning and ending square footage.
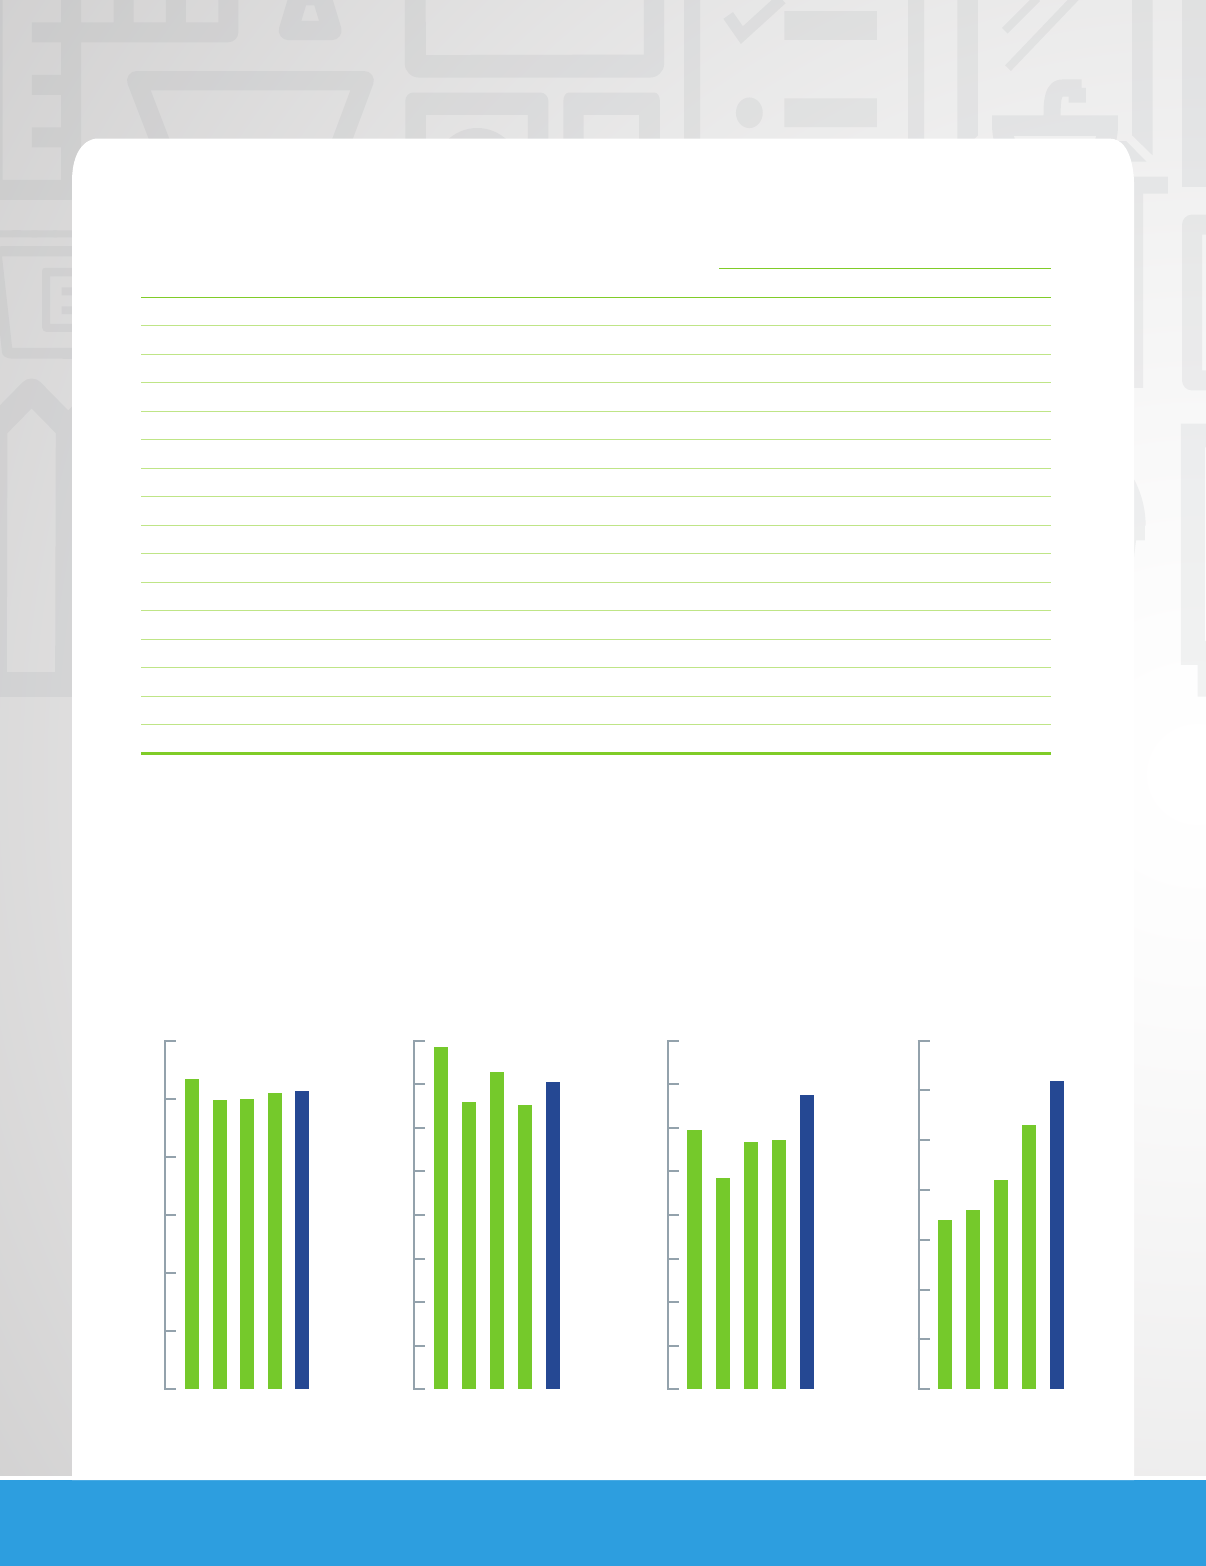
EBIT MARGIN2
(in percent)
0
1.0
2.0
3.0
4.0
5.0
6.0
7.0
8.0
’12
’11’10
’09’08
DILUTED EARNINGS
PER COMMON SHARE
(in dollars)
0
0.25
0.50
0.75
1.00
1.25
1.50
1.75
2.00
’12
’11’10
’09’08
CASH DIVIDENDS
PER SHARE
(in dollars)
0
0.10
0.20
0.30
0.40
0.50
0.60
0.70
’12
’11’10
’09’08
SALES PER SELLING
SQUARE FOOT6
(in dollars)
’12
’11’10
’09’08
0
50
100
150
200
250
300
Financial Highlights
Lowe’s Companies, Inc. 2012 Annual Report page 8