Lowe's 2012 Annual Report Download - page 30
Download and view the complete annual report
Please find page 30 of the 2012 Lowe's annual report below. You can navigate through the pages in the report by either clicking on the pages listed below, or by using the keyword search tool below to find specific information within the annual report.-
 1
1 -
2
-
3
-
4
-
5
-
6
-
7
-
8
-
9
-
10
-
11
-
12
-
13
-
14
-
15
-
16
-
17
-
18
-
19
-
 20
20 -
 21
21 -
 22
22 -
 23
23 -
 24
24 -
 25
25 -
 26
26 -
 27
27 -
 28
28 -
 29
29 -
 30
30 -
 31
31 -
 32
32 -
 33
33 -
 34
34 -
 35
35 -
 36
36 -
 37
37 -
 38
38 -
 39
39 -
 40
40 -
41
-
42
-
43
-
44
-
45
-
46
-
47
-
48
-
49
-
50
-
51
-
52
-
53
-
54
-
55
-
56
-
57
-
58
-
59
-
60
-
61
-
62
-
63
-
64
-
65
-
66
-
67
-
68
-
69
-
70
-
71
-
72
-
73
-
74
-
75
-
76
-
77
-
78
-
79
-
80
-
81
-
82
-
83
-
84
-
85
-
86
-
87
-
88
 |
 |

16
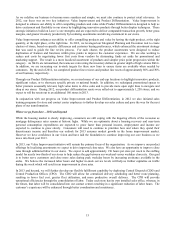
We will also build trust by partnering with customers to recommend solutions that fit their needs and to help them make the
right decisions based on their individual home improvement goals. Beyond 2013, we will further enhance our sales culture
by providing our associates the ability to sell seamlessly across channels and to introduce improved project management
tools that expand fulfillment capabilities to cultivate personal and simple connections with customers. Associates across
selling channels will be provided with a single-view of the customer; one record per customer, from lead capture to project
completion. These changes will enable us to improve close rates and capitalize on the momentum of the improving
economy and increases in consumer discretionary spending.
By building on core strengths, we have laid the foundation to deliver on our commitment to retail excellence, and will
continue to focus on developing the capabilities to provide our customers a seamless and simple home improvement
experience going forward.
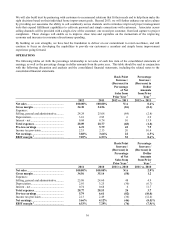
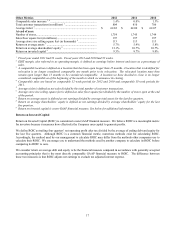
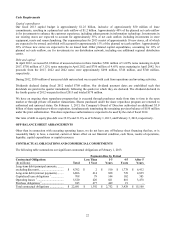
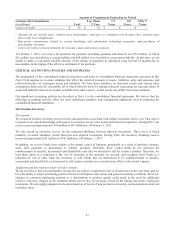
OPERATIONS
The following tables set forth the percentage relationship to net sales of each line item of the consolidated statements of
earnings, as well as the percentage change in dollar amounts from the prior year. This table should be read in conjunction
with the following discussion and analysis and the consolidated financial statements, including the related notes to the
consolidated financial statements.
Basis Point
Increase
/
(Decrease) in
Percenta
g
e
of Net
Sales from
Prior Year 1
Percentage
Increase /
(Decrease) in
Dollar
Amounts
from Prior
Year 1
2012 2011 2012 vs. 2011 2012 vs. 2011
Net sales .................................................. 100.00% 100.00% N/A 0.6%
Gross margin .......................................... 34.30 34.56 (26) (0.1)
Expenses:
Selling, general and administrative .......... 24.24 25.08 (84) (2.8)
Depreciation ............................................. 3.01 2.95 6 2.9
Interest - net ............................................. 0.84 0.74 10 13.9
Total expenses ........................................ 28.09 28.77 (68) (1.8)
Pre-tax earnings ..................................... 6.21 5.79 42 7.9
Income tax provision ............................... 2.33 2.13 20 10.4
Net earnings ............................................ 3.88% 3.66% 22 6.5%
EBIT margin 2 ........................................ 7.05% 6.53% 52 8.6%
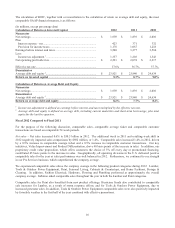
Basis Point
Increase
/
(Decrease) in
Percentage
of Net
Sales from
Prior Year 1
Percentage
Increase
/
(Decrease) in
Dollar
Amounts
from Prior
Year 1
2011 2010 2011 vs. 2010 2011 vs. 2010
Net sales .................................................. 100.00% 100.00% N/A 2.9%
Gross margin .......................................... 34.56 35.14 (58) 1.2
Expenses:
Selling, general and administrative .......... 25.08 24.60 48 4.9
Depreciation ............................................. 2.95 3.25 (30) (6.7)
Interest - net ............................................. 0.74 0.68 6 11.7
Total expenses ........................................ 28.77 28.53 24 3.7
Pre-tax earnings ..................................... 5.79 6.61 (82) (10.0)
Income tax provision ............................... 2.13 2.49 (36) (12.4)
Net earnings ............................................ 3.66% 4.12% (46) (8.5) %
EBIT margin 2 ........................................ 6.53% 7.29% (76) (7.9) %