Lowe's 2012 Annual Report Download - page 35
Download and view the complete annual report
Please find page 35 of the 2012 Lowe's annual report below. You can navigate through the pages in the report by either clicking on the pages listed below, or by using the keyword search tool below to find specific information within the annual report.-
 1
1 -
2
-
3
-
4
-
5
-
6
-
7
-
8
-
9
-
10
-
11
-
12
-
13
-
14
-
15
-
16
-
17
-
18
-
19
-
20
-
21
-
22
-
23
-
24
-
 25
25 -
 26
26 -
 27
27 -
 28
28 -
 29
29 -
 30
30 -
 31
31 -
 32
32 -
 33
33 -
 34
34 -
 35
35 -
 36
36 -
 37
37 -
 38
38 -
 39
39 -
 40
40 -
 41
41 -
 42
42 -
 43
43 -
 44
44 -
 45
45 -
46
-
47
-
48
-
49
-
50
-
51
-
52
-
53
-
54
-
55
-
56
-
57
-
58
-
59
-
60
-
61
-
62
-
63
-
64
-
65
-
66
-
67
-
68
-
69
-
70
-
71
-
72
-
73
-
74
-
75
-
76
-
77
-
78
-
79
-
80
-
81
-
82
-
83
-
84
-
85
-
86
-
87
-
88
 |
 |

21
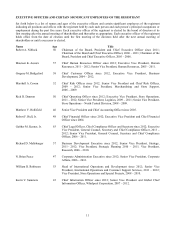
LOWE’S BUSINESS OUTLOOK
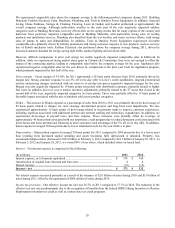
As of February 25, 2013, the date of our fourth quarter 2012 earnings release, we expected total sales in 2013 to increase
approximately 4% and comparable sales to increase approximately 3.5%. We expected to open approximately 10 stores
during 2013. In addition, earnings before interest and taxes as a percentage of sales (operating margin) were expected to
increase approximately 60 basis points and the effective tax rate was expected to be approximately 38.1%. Diluted earnings
per share of $2.05 were expected for the fiscal year ending January 31, 2014. Our guidance assumed approximately $4
billion in share repurchases during 2013, spread evenly across the four quarters.
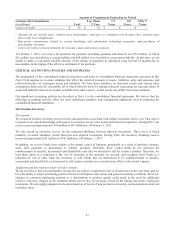
FINANCIAL CONDITION, LIQUIDITY AND CAPITAL RESOURCES
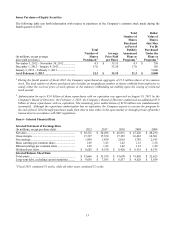
Cash Flows
Cash flows from operating activities continued to provide the primary source of our liquidity. The decrease in net cash
provided by operating activities for 2012 versus 2011 was primarily driven by changes in working capital. The change in
working capital was primarily driven by the timing of tax payments during the periods. The decrease in net cash used in
investing activities for 2012 versus 2011 was primarily driven by a decrease in capital expenditures in addition to an
increase in proceeds received from the sale of property and other long-term assets, partially offset by lower proceeds from
the sale/maturity of investments. The increase in net cash used in financing activities for 2012 was primarily driven by an
increase in cash used to repurchase shares, which included shares repurchased under our share repurchase program and
shares withheld from employees to satisfy statutory tax withholding liabilities upon vesting of restricted stock awards. This
was partially offset by the net change in long-term debt and an increase in proceeds from the issuance of common stock
due to options exercised.
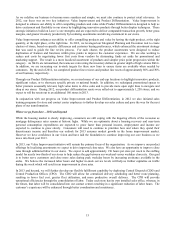
Sources of Liquidity
In addition to our cash flows from operations, liquidity is provided by our short-term borrowing facilities. We have a $1.75
billion senior credit facility that expires in October 2016. The senior credit facility supports our commercial paper program
and has a $500 million letter of credit sublimit. Letters of credit issued pursuant to the senior credit facility reduce the
amount available for borrowing under its terms. Borrowings made are unsecured and are priced at fixed rates based upon
market conditions at the time of funding in accordance with the terms of the senior credit facility. The senior credit facility
contains certain restrictive covenants, which include maintenance of a debt leverage ratio as defined by the senior credit
facility. We were in compliance with those covenants at February 1, 2013. Thirteen banking institutions are participating in
the senior credit facility. There were no outstanding borrowings or letters of credit under the senior credit facility and no
outstanding borrowings under our commercial paper program at February 1, 2013.
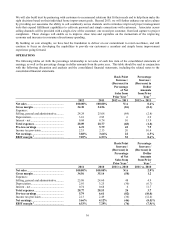
We expect to continue to have access to the capital markets on both short-term and long-term bases when needed for
liquidity purposes by issuing commercial paper or new long-term debt. The availability and the borrowing costs of these
funds could be adversely affected, however, by a downgrade of our debt ratings or a deterioration of certain financial
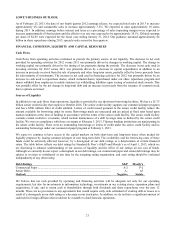
ratios. The table below reflects our debt ratings by Standard & Poor’s (S&P) and Moody’s as of April 1, 2013, which we
are disclosing to enhance understanding of our sources of liquidity and the effect of our ratings on our cost of funds.
Although we currently do not expect a downgrade in our debt ratings, our commercial paper and senior debt ratings may be
subject to revision or withdrawal at any time by the assigning rating organization, and each rating should be evaluated
independently of any other rating.
Debt Ratings S&P Moody’s
Commercial Paper ................................................................................................... A-2 P-2
Senior Debt .............................................................................................................. A- A3
Outlook ................................................................................................................... Negative Stable
We believe that net cash provided by operating and financing activities will be adequate not only for our operating
requirements, but also for investments in information technology, investments in our existing stores, expansion plans and
acquisitions, if any, and to return cash to shareholders through both dividends and share repurchases over the next 12
months. There are no provisions in any agreements that would require early cash settlement of existing debt or leases as a
result of a downgrade in our debt rating or a decrease in our stock price. In addition, we do not have a significant amount of
cash held in foreign affiliates that would not be available to fund domestic operations.