Lowe's 2012 Annual Report Download - page 69
Download and view the complete annual report
Please find page 69 of the 2012 Lowe's annual report below. You can navigate through the pages in the report by either clicking on the pages listed below, or by using the keyword search tool below to find specific information within the annual report.-
 1
1 -
2
-
3
-
4
-
5
-
6
-
7
-
8
-
9
-
10
-
11
-
12
-
13
-
14
-
15
-
16
-
17
-
18
-
19
-
20
-
21
-
22
-
23
-
24
-
25
-
26
-
27
-
28
-
29
-
30
-
31
-
32
-
33
-
34
-
35
-
36
-
37
-
38
-
39
-
40
-
41
-
42
-
43
-
44
-
45
-
46
-
47
-
48
-
49
-
50
-
51
-
52
-
53
-
54
-
55
-
56
-
57
-
58
-
 59
59 -
 60
60 -
 61
61 -
 62
62 -
 63
63 -
 64
64 -
 65
65 -
 66
66 -
 67
67 -
 68
68 -
 69
69 -
 70
70 -
 71
71 -
 72
72 -
 73
73 -
 74
74 -
 75
75 -
 76
76 -
 77
77 -
 78
78 -
 79
79 -
80
-
81
-
82
-
83
-
84
-
85
-
86
-
87
-
88
 |
 |

55
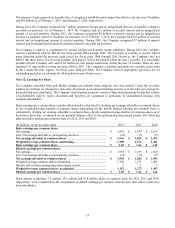
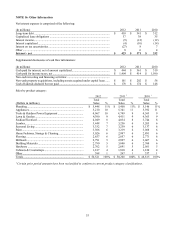
NOTE 16: Other Information
Net interest expense is comprised of the following:
(In millions) 2012 2011 2010
Long-term debt ....................................................................................................... $ 418 $ 341 $ 312
Capitalized lease obligations .................................................................................. 37 38 35
Interest income........................................................................................................ (9) (12) (12)
Interest capitalized .................................................................................................. (4) (10) (14)
Interest on tax uncertainties .................................................................................... (27) 8 7
Other ....................................................................................................................... 8 6 4
Interest - net .......................................................................................................... $ 423 $ 371 $ 332
Supplemental disclosures of cash flow information:
(In millions) 2012 2011 2010
Cash paid for interest, net of amount capitalized .................................................... $ 444 $ 361 $ 319
Cash paid for income taxes, net .............................................................................. $ 1,404 $ 914 $ 1,590
N
on-cash investing and financing activities: ..........................................................
N
on-cash property acquisitions, including assets acquired under capital lease ...... $ 101 $ 202 $ 56
Cash dividends declared but not paid ..................................................................... $ 178 $ 174 $ 148
Sales by product category:
2012 2011
1 2010
1
(Dollars in millions)
Total
Sales %
Total
Sales %
Total
Sales %
Plumbing ............................................................................. $ 5,448 11 % $ 5,400 11 % $ 5,146 11%
Appliances .......................................................................... 5,210 10 5,341 11 5,392 11
Tools & Outdoor Power Equipment ................................... 4,967 10 4,749 9 4,563 9
Lawn & Garden .................................................................. 4,390 9 4,411 9 4,363 9
Fashion Electrical ............................................................... 4,049 8 4,034 8 3,744 8
Lumber................................................................................ 3,448 7 3,256 6 3,205 6
Seasonal Living .................................................................. 3,332 7 3,239 6 3,137 6
Paint .................................................................................... 3,306 6 3,219 6 3,068 6
Home Fashions, Storage & Cleaning .................................. 3,026 6 2,997 6 2,891 6
Flooring .............................................................................. 2,857 6 2,857 6 2,771 6
Millwork ............................................................................. 2,791 5 2,897 6 3,067 6
Building Materials .............................................................. 2,790 5 3,040 6 2,760 6
Hardware ............................................................................ 2,702 5 2,691 5 2,561 5
Cabinets & Countertops ...................................................... 1,817 4 1,810 4 1,810 4
Other ................................................................................... 388 1 267 1 337 1
Totals .................................................................................. $ 50,521 100 % $ 50,208 100 % $ 48,815 100%
1 Certain prior period amounts have been reclassified to conform to current product category classifications.