Lowe's 2012 Annual Report Download - page 33
Download and view the complete annual report
Please find page 33 of the 2012 Lowe's annual report below. You can navigate through the pages in the report by either clicking on the pages listed below, or by using the keyword search tool below to find specific information within the annual report.-
 1
1 -
2
-
3
-
4
-
5
-
6
-
7
-
8
-
9
-
10
-
11
-
12
-
13
-
14
-
15
-
16
-
17
-
18
-
19
-
20
-
21
-
22
-
 23
23 -
 24
24 -
 25
25 -
 26
26 -
 27
27 -
 28
28 -
 29
29 -
 30
30 -
 31
31 -
 32
32 -
 33
33 -
 34
34 -
 35
35 -
 36
36 -
 37
37 -
 38
38 -
 39
39 -
 40
40 -
 41
41 -
 42
42 -
 43
43 -
44
-
45
-
46
-
47
-
48
-
49
-
50
-
51
-
52
-
53
-
54
-
55
-
56
-
57
-
58
-
59
-
60
-
61
-
62
-
63
-
64
-
65
-
66
-
67
-
68
-
69
-
70
-
71
-
72
-
73
-
74
-
75
-
76
-
77
-
78
-
79
-
80
-
81
-
82
-
83
-
84
-
85
-
86
-
87
-
88
 |
 |

19
Comparable sales were below the company average in Building Materials, Millwork, Appliances, and Lawn & Garden.
The timing of storm recovery and repair efforts in 2012 as compared to 2011 resulted in decreased comparable sales in
Building Materials. In addition, difficult comparisons to prior year promotional activity led to decreased comparable sales
in Millwork and Appliances. Lawn & Garden was impacted by extreme heat and drought conditions in the first half of the
year, slightly offset by improved inventory planning and attachment rates in the second half of the year.
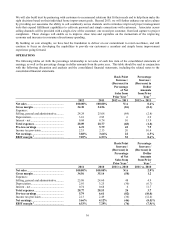
Gross margin – Gross margin of 34.3% for 2012 represented a 26 basis point decrease from 2011, primarily driven by an
unfavorable 19 basis point impact related to our proprietary credit value proposition. In addition, we experienced a seven
basis point unfavorable impact to margin related to pricing and promotional activity.
SG&A – The 84 basis point decrease in SG&A expense as a percentage of sales from 2011 to 2012 was primarily driven by
81 basis points of leverage due to long-lived asset impairment and other costs associated with the 27 store closures and
discontinued projects in 2011. We also experienced approximately 35 basis points of leverage associated with our
proprietary credit program, which was driven by increased portfolio income as a result of continued growth in the program.
These were partially offset by deleverage of approximately 15 basis points associated with incentive compensation, due to
higher attainment levels compared to targets for store-based employees relative to last year. In addition, we experienced
nine basis points of deleverage in contract labor associated with information technology projects to improve customer
experiences.
Depreciation – Depreciation expense deleveraged six basis points for 2012 compared to 2011 primarily due to higher
depreciation associated with IT capital investments made to improve customer experiences, which have shorter average
useful lives. Property, less accumulated depreciation, decreased to $21.5 billion at February 1, 2013 compared to $22.0
billion at February 3, 2012. At February 1, 2013 and February 3, 2012, we owned 89% of our stores, which included stores
on leased land.
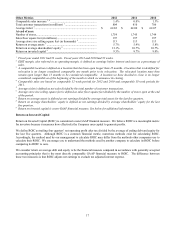
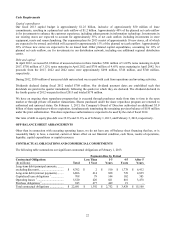
Interest – Net – Net interest expense is comprised of the following:
(In millions) 2012 2011
Interest expense, net of amount capitalized ............................................................... $ 427 $ 379
Amortization of original issue discount and loan costs ............................................. 5 4
Interest income........................................................................................................... (9) (12)
Interest - net ............................................................................................................. $ 423 $ 371
Net interest expense increased primarily as a result of the issuance of $1.0 billion and $2.0 billion of unsecured notes in
November 2011 and April 2012, respectively, partially offset by favorable tax settlements that resulted in a reduced interest
accrual during 2012.
Income tax provision – Our effective income tax rate was 37.6% in 2012 compared to 36.7% in 2011. The lower effective
tax rate in 2011 was the result of the recognition of one-time federal employee retention benefits from the federal HIRE
(Hiring Incentives to Restore Employment) retention tax credit, as well as the favorable settlement of certain state tax
matters in the third quarter of 2011.
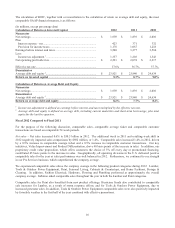
Fiscal 2011 Compared to Fiscal 2010
For the purpose of the following discussion, comparable sales, comparable average ticket and comparable customer
transactions are based on comparable 53-week periods.
Net sales – Net sales increased 2.9% to $50.2 billion in 2011, while comparable sales were flat. The additional week in
2011 contributed 1.6% to the increase in net sales. Comparable customer transactions increased approximately 0.4% and
comparable average ticket decreased 0.4% versus 2010.
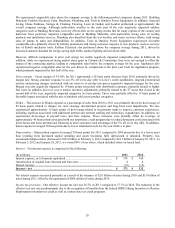
While comparable sales were flat in 2011, we saw sequential improvement each quarter, with comparable sales of negative
3.3% in the first quarter, negative 0.3% in the second quarter, positive 0.7% in the third quarter and positive 3.4% in the
fourth quarter. Unseasonably cold, wet weather, severe storms and flooding during the first quarter as well as comparisons
to the 2010 Cash for Appliances government incentive program led to lower performance during the first half of the year.
However, as comparisons to the Cash for Appliances program eased and storm recovery efforts were underway, we saw
improvement in comparable sales. In addition, strong customer response to our 5% off every-day offer to Lowe’s credit
cardholders, launched in the first half of 2011, aided comparable sales for the balance of the year.