Lowe's 2012 Annual Report Download - page 15
Download and view the complete annual report
Please find page 15 of the 2012 Lowe's annual report below. You can navigate through the pages in the report by either clicking on the pages listed below, or by using the keyword search tool below to find specific information within the annual report.-
 1
1 -
2
-
3
-
4
-
 5
5 -
 6
6 -
 7
7 -
 8
8 -
 9
9 -
 10
10 -
 11
11 -
 12
12 -
 13
13 -
 14
14 -
 15
15 -
 16
16 -
 17
17 -
 18
18 -
 19
19 -
 20
20 -
 21
21 -
 22
22 -
 23
23 -
 24
24 -
 25
25 -
26
-
27
-
28
-
29
-
30
-
31
-
32
-
33
-
34
-
35
-
36
-
37
-
38
-
39
-
40
-
41
-
42
-
43
-
44
-
45
-
46
-
47
-
48
-
49
-
50
-
51
-
52
-
53
-
54
-
55
-
56
-
57
-
58
-
59
-
60
-
61
-
62
-
63
-
64
-
65
-
66
-
67
-
68
-
69
-
70
-
71
-
72
-
73
-
74
-
75
-
76
-
77
-
78
-
79
-
80
-
81
-
82
-
83
-
84
-
85
-
86
-
87
-
88
 |
 |
1
Part I
Item 1 - Business
General Information
Lowe’s Companies, Inc. and subsidiaries (the Company or Lowe’s) is a Fortune® 100 company and the world’s second
largest home improvement retailer. As of February 1, 2013, we operated 1,754 stores, comprised of 1,715 stores across 50
U.S. states, 34 stores in Canada and five stores in Mexico. These stores represent approximately 197 million square feet of
retail selling space. In 2013, we expect to open approximately 10 stores.
Lowe’s was incorporated in North Carolina in 1952 and has been publicly held since 1961. The Company’s common stock
is listed on the New York Stock Exchange - ticker symbol “LOW”.
See Item 6, “Selected Financial Data”, of this Annual Report on Form 10-K, for historical revenues, profits and identifiable
assets. For additional information about the Company’s performance and financial condition, see also Item 7,
“Management’s Discussion and Analysis of Financial Condition and Results of Operations”, of this Annual Report on
Form 10-K.
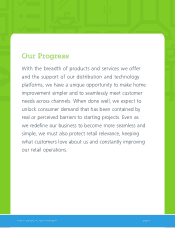
Our Promise
We strive to be customers’ first choice for home improvement. Customers expect that we will not only sell the products
they need and want, but also deliver a full solution by being a partner through each step of the home improvement process,
from inspiration and planning to completion and enjoyment. Our goal is to make the process of home improvement as
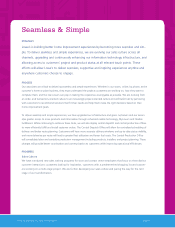
seamless and simple as possible, while ensuring we remain relevant to our customers. We have several initiatives designed
to deliver seamless and simple experiences, which include evolving our sales culture across all selling channels, upgrading
and continuously enhancing our information technology infrastructure, and allowing access to customers’ project and
product status at all relevant touch points.
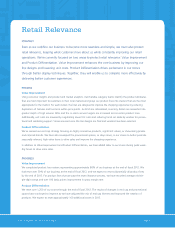
Customers, Market and Competition
Our Customers
We serve homeowners, renters and commercial business customers (Pro customer). Individual homeowners and renters
complete a wide array of projects and vary along the spectrum of do-it-yourself (DIY) and do-it-for-me (DIFM). The Pro
customer consists of two broad categories, construction trade and maintenance & repair organizations.
Based on our analysis of the market we have identified various types of home improvement customer mindsets. Our target
customer mindset is the “creator”, whether they are a homeowner, renter, or Pro customer. Creators seek quality tailored
experiences, and are on the lookout for new ideas to improve homes. The creator is the most active in the home
improvement category in terms of visits and amount of spend. We believe that if we focus on the needs of these more
discerning customers we will meet or exceed the needs of other customers.
Our Market
We are among the many businesses, including home centers, paint stores, hardware stores, lumber yards and garden
centers, whose revenues are included in the Building Material and Garden Equipment and Supplies Dealers Subsector
(444) of the Retail Trade Sector of the North American Industry Classification System (NAICS), the standard used by
Federal statistical agencies in classifying business establishments for the purpose of collecting, analyzing, and publishing
statistical data related to the U.S. business economy. The total annual revenue reported for businesses included in NAICS
444 in 2012 was $294 billion, which represented an increase of 5.4% from the total amount reported in 2011. The total
annual revenue reported for businesses included in NAICS 444 in 2011 was $279 billion, which represented an increase of
4.1% over the amount reported for 2010.