Lowe's 2012 Annual Report Download - page 34
Download and view the complete annual report
Please find page 34 of the 2012 Lowe's annual report below. You can navigate through the pages in the report by either clicking on the pages listed below, or by using the keyword search tool below to find specific information within the annual report.-
 1
1 -
2
-
3
-
4
-
5
-
6
-
7
-
8
-
9
-
10
-
11
-
12
-
13
-
14
-
15
-
16
-
17
-
18
-
19
-
20
-
21
-
22
-
23
-
 24
24 -
 25
25 -
 26
26 -
 27
27 -
 28
28 -
 29
29 -
 30
30 -
 31
31 -
 32
32 -
 33
33 -
 34
34 -
 35
35 -
 36
36 -
 37
37 -
 38
38 -
 39
39 -
 40
40 -
 41
41 -
 42
42 -
 43
43 -
 44
44 -
45
-
46
-
47
-
48
-
49
-
50
-
51
-
52
-
53
-
54
-
55
-
56
-
57
-
58
-
59
-
60
-
61
-
62
-
63
-
64
-
65
-
66
-
67
-
68
-
69
-
70
-
71
-
72
-
73
-
74
-
75
-
76
-
77
-
78
-
79
-
80
-
81
-
82
-
83
-
84
-
85
-
86
-
87
-
88
 |
 |

20
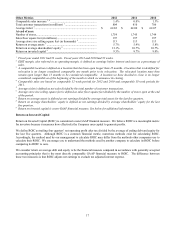
We experienced comparable sales above the company average in the following product categories during 2011: Building
Materials, Fashion Electrical, Paint, Hardware, Plumbing, and Tools & Outdoor Power Equipment. In addition, Seasonal
Living, Home Fashions, Storage & Cleaning, Flooring, Lawn & Garden and Lumber performed at approximately the
overall company average. Although unfavorable weather in the early part of the year negatively impacted outdoor
categories such as Building Materials, recovery efforts after severe spring storms that hit many regions of the country and
hurricane Irene positively impacted comparable sales in Building Materials, with particularly strong sales of roofing
products and installation services. Plumbing also benefited from the wet weather and storm recovery efforts, with strong
sales of pumps & tanks and dehumidifiers. In addition, Tools & Outdoor Power Equipment experienced favorable
comparable sales primarily driven by holiday promotions and strong customer response to new products, such as our new
line of Kobalt mechanics tools. Fashion Electrical also performed above the company average during 2011, driven by
increased customer demand for energy-saving light bulbs, outdoor lighting and electrical cable.
However, difficult comparisons to prior year energy tax credits negatively impacted comparable sales in Millwork. In
addition, while we experienced strong market share gains in Cabinets & Countertops, they were not enough to offset the
impact of the contracting market, leading to comparable sales below the company average for the year. Appliances also
experienced negative comparable sales for the year driven by comparisons to the prior year Cash for Appliances program,
which primarily impacted the first half of the year.
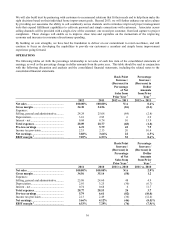
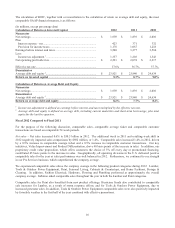
Gross margin – Gross margin of 34.56% for 2011 represented a 58 basis point decrease from 2010, primarily driven by
margin rate. Strong customer response to our 5% off every-day offer to Lowe’s credit cardholders, targeted promotional
activity and pricing changes associated with our move to every-day low prices negatively impacted margin for the year.
Margin was also negatively impacted by 19 basis points associated with distribution expenses, primarily related to higher
fuel costs. In addition, lower of cost or market inventory adjustments, primarily related to the 27 stores that closed in the
second half of the year, negatively impacted margin by six basis points. These were partially offset by 15 basis points of
favorable impact associated with the mix of products sold across product categories.
SG&A – The increase in SG&A expense as a percentage of sales from 2010 to 2011 was primarily driven by de-leverage of
83 basis points related to charges for store closings, discontinued projects and long-lived asset impairments. We also
experienced approximately 15 basis points of de-leverage related to investments made to improve customer experiences,
including expenses associated with additional internal and external staffing and technology expenditures. In addition, we
experienced de-leverage in payroll taxes and fleet expense. These increases were partially offset by leverage of
approximately 40 basis points associated with our proprietary credit program due to reduced program costs associated with
lower losses and lower promotional financing as more customers took advantage of the 5% off every day offer. In addition,
bonus expense leveraged 30 basis points due to lower attainment levels for the year relative to plan.
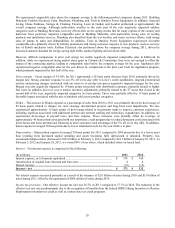
Depreciation – Depreciation expense leveraged 30 basis points for 2011 compared to 2010 primarily due to a lower asset
base resulting from decreased capital spending and assets becoming fully depreciated or impaired. Property, less
accumulated depreciation, decreased to $22.0 billion at February 3, 2012 compared to $22.1 billion at January 28, 2011. At
February 3, 2012 and January 28, 2011, we owned 89% of our stores, which included stores on leased land.
Interest – Net interest expense is comprised of the following:
(In millions) 2011 2010
Interest expense, net of amount capitalized ............................................................... $ 379 $ 340
Amortization of original issue discount and loan costs ............................................. 4 4
Interest income........................................................................................................... (12) (12)
Interest - net ............................................................................................................. $ 371 $ 332
Net interest expense increased primarily as a result of the issuance of $2.0 billion of notes during 2010 and $1.0 billion of
notes during 2011, offset by the repayment of $500 million of notes during 2010.
Income tax provision – Our effective income tax rate was 36.7% in 2011 compared to 37.7% in 2010. The reduction in the
effective tax rate was predominantly due to the recognition of benefits from the federal HIRE (Hiring Incentives to Restore
Employment) retention tax credit as well as various state tax credit programs.