Lowe's 2012 Annual Report Download - page 31
Download and view the complete annual report
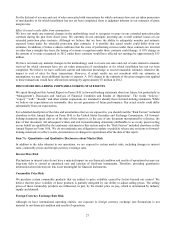
Please find page 31 of the 2012 Lowe's annual report below. You can navigate through the pages in the report by either clicking on the pages listed below, or by using the keyword search tool below to find specific information within the annual report.-
 1
1 -
2
-
3
-
4
-
5
-
6
-
7
-
8
-
9
-
10
-
11
-
12
-
13
-
14
-
15
-
16
-
17
-
18
-
19
-
20
-
 21
21 -
 22
22 -
 23
23 -
 24
24 -
 25
25 -
 26
26 -
 27
27 -
 28
28 -
 29
29 -
 30
30 -
 31
31 -
 32
32 -
 33
33 -
 34
34 -
 35
35 -
 36
36 -
 37
37 -
 38
38 -
 39
39 -
 40
40 -
 41
41 -
42
-
43
-
44
-
45
-
46
-
47
-
48
-
49
-
50
-
51
-
52
-
53
-
54
-
55
-
56
-
57
-
58
-
59
-
60
-
61
-
62
-
63
-
64
-
65
-
66
-
67
-
68
-
69
-
70
-
71
-
72
-
73
-
74
-
75
-
76
-
77
-
78
-
79
-
80
-
81
-
82
-
83
-
84
-
85
-
86
-
87
-
88
 |
 |

17
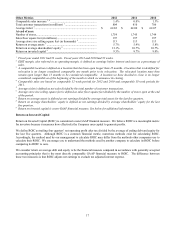
Other Metrics 2012 2011 2010
Comparable sales increase 3, 4 ............................................................... 1.4% 0.0% 1.3%
Total customer transactions (in millions) 1 ........................................... 804 810 786
Average ticket 5 ..................................................................................... $ 62.82 $ 62.00 $ 62.07
At end of year:
N
umber of stores ................................................................................... 1,754 1,745 1,749
Sales floor square feet (in millions) ...................................................... 197 197 197
Average store size selling square feet (in thousands) 6 ......................... 113 113 113
Return on average assets 7 .................................................................... 5.7% 5.4% 5.8%
Return on average shareholders' equity 8 .............................................. 13.1% 10.7% 10.7%
Return on invested capital 9 .................................................................. 9.3% 8.7% 9.0%
1 Fiscal year ended 2011 had 53 weeks. Fiscal years 2012 and 2010 had 52 weeks.
2 EBIT margin, also referred to as operating margin, is defined as earnings before interest and taxes as a percentage of
sales.
3 A comparable location is defined as a location that has been open longer than 13 months. A location that is identified for
relocation is no longer considered comparable one month prior to its relocation. The relocated location must then
remain open longer than 13 months to be considered comparable. A location we have decided to close is no longer
considered comparable as of the beginning of the month in which we announce its closing.
4 Comparable sales are based on comparable 52-week periods for 2012 and 2010 and comparable 53-week periods for
2011.
5 Average ticket is defined as net sales divided by the total number of customer transactions.
6 Average store size selling square feet is defined as sales floor square feet divided by the number of stores open at the end
of the period.
7 Return on average assets is defined as net earnings divided by average total assets for the last five quarters.
8 Return on average shareholders’ equity is defined as net earnings divided by average shareholders’ equity for the last
five quarters.
9 Return on invested capital is a non-GAAP financial measure. See below for additional information.
Return on Invested Capital
Return on Invested Capital (ROIC) is considered a non-GAAP financial measure. We believe ROIC is a meaningful metric
for investors because it measures how effectively the Company uses capital to generate profits.
We define ROIC as trailing four quarters’ net operating profit after tax divided by the average of ending debt and equity for
the last five quarters. Although ROIC is a common financial metric, numerous methods exist for calculating ROIC.
Accordingly, the method used by our management to calculate ROIC may differ from the methods other companies use to
calculate their ROIC. We encourage you to understand the methods used by another company to calculate its ROIC before
comparing its ROIC to ours.
We consider return on average debt and equity to be the financial measure computed in accordance with generally accepted
accounting principles that is the most directly comparable GAAP financial measure to ROIC. The difference between
these two measures is that ROIC adjusts net earnings to exclude tax adjusted interest expense.