Lowe's 2012 Annual Report Download - page 56
Download and view the complete annual report
Please find page 56 of the 2012 Lowe's annual report below. You can navigate through the pages in the report by either clicking on the pages listed below, or by using the keyword search tool below to find specific information within the annual report.-
 1
1 -
2
-
3
-
4
-
5
-
6
-
7
-
8
-
9
-
10
-
11
-
12
-
13
-
14
-
15
-
16
-
17
-
18
-
19
-
20
-
21
-
22
-
23
-
24
-
25
-
26
-
27
-
28
-
29
-
30
-
31
-
32
-
33
-
34
-
35
-
36
-
37
-
38
-
39
-
40
-
41
-
42
-
43
-
44
-
45
-
 46
46 -
 47
47 -
 48
48 -
 49
49 -
 50
50 -
 51
51 -
 52
52 -
 53
53 -
 54
54 -
 55
55 -
 56
56 -
 57
57 -
 58
58 -
 59
59 -
 60
60 -
 61
61 -
 62
62 -
 63
63 -
 64
64 -
 65
65 -
 66
66 -
67
-
68
-
69
-
70
-
71
-
72
-
73
-
74
-
75
-
76
-
77
-
78
-
79
-
80
-
81
-
82
-
83
-
84
-
85
-
86
-
87
-
88
 |
 |

42
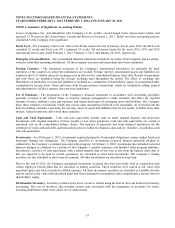
Fair Value Measurements at Reporting
Date Using
February 3,
2012
(In millions) Level 1 Level 2 Level 3
Available-for-sale securities:
Municipal obligations .......................................................... $ 79 $ - $ 79 $ -
Money market funds ............................................................ 153 153 - -
Municipal floating rate obligations ..................................... 25 - 25 -
Other .................................................................................... 2 2 - -
Trading securities:
Mutual funds ....................................................................... 27 27 - -
Total short-term investments ............................................... $ 286 $ 182 $ 104 $ -
Available-for-sale securities:
Municipal floating rate obligations ..................................... $ 363 $ - $ 363 $ -
Municipal obligations .......................................................... 122 - 122 -
Other .................................................................................... 19 - 19 -
Total long-term investments ................................................ $ 504 $ - $ 504 $ -
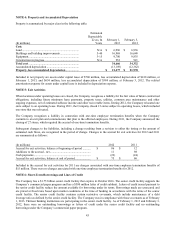
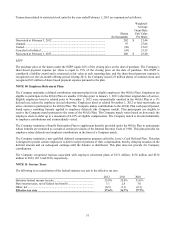
When available, quoted prices were used to determine fair value. When quoted prices in active markets were available,
investments were classified within Level 1 of the fair value hierarchy. When quoted prices in active markets were not
available, fair values were determined using pricing models, and the inputs to those pricing models were based on
observable market inputs. The inputs to the pricing models were typically benchmark yields, reported trades, broker-dealer
quotes, issuer spreads and benchmark securities, among others.
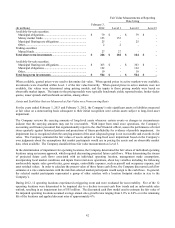
Assets and Liabilities that are Measured at Fair Value on a Nonrecurring Basis
For the years ended February 1, 2013 and February 3, 2012, the Company’s only significant assets or liabilities measured
at fair value on a nonrecurring basis subsequent to their initial recognition were certain assets subject to long-lived asset
impairment.
The Company reviews the carrying amounts of long-lived assets whenever certain events or changes in circumstances
indicate that the carrying amounts may not be recoverable. With input from retail store operations, the Company’s
accounting and finance personnel that organizationally report to the chief financial officer, assess the performance of retail
stores quarterly against historical patterns and projections of future profitability for evidence of possible impairment. An
impairment loss is recognized when the carrying amount of the asset (disposal) group is not recoverable and exceeds its fair
value. The Company estimated the fair values of assets subject to long-lived asset impairment based on the Company’s
own judgments about the assumptions that market participants would use in pricing the assets and on observable market
data, when available. The Company classified these fair value measurements as Level 3.
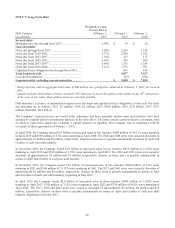
In the determination of impairment for operating locations, the Company determined the fair values of individual operating
locations using an income approach, which required discounting projected future cash flows. When determining the stream
of projected future cash flows associated with an individual operating location, management made assumptions,
incorporating local market conditions and inputs from retail store operations, about key variables including the following
unobservable inputs: sales growth rates, gross margin, controllable expenses, such as payroll and occupancy expense, and
asset residual values. In order to calculate the present value of those future cash flows, the Company discounted cash flow
estimates at a rate commensurate with the risk that selected market participants would assign to the cash flows. In general,
the selected market participants represented a group of other retailers with a location footprint similar in size to the
Company’s.
During 2012, 12 operating locations experienced a triggering event and were evaluated for recoverability. Five of the 12
operating locations were determined to be impaired due to a decline in recent cash flow trends and an unfavorable sales
outlook, resulting in an impairment loss of $55 million. The discounted cash flow model used to estimate the fair value of
the impaired operating locations assumed average annual sales growth rates ranging from 2.0% to 4.0% over the remaining
life of the locations and applied discount rates of approximately 6%.