Lowe's 2012 Annual Report Download - page 32
Download and view the complete annual report
Please find page 32 of the 2012 Lowe's annual report below. You can navigate through the pages in the report by either clicking on the pages listed below, or by using the keyword search tool below to find specific information within the annual report.-
 1
1 -
2
-
3
-
4
-
5
-
6
-
7
-
8
-
9
-
10
-
11
-
12
-
13
-
14
-
15
-
16
-
17
-
18
-
19
-
20
-
21
-
 22
22 -
 23
23 -
 24
24 -
 25
25 -
 26
26 -
 27
27 -
 28
28 -
 29
29 -
 30
30 -
 31
31 -
 32
32 -
 33
33 -
 34
34 -
 35
35 -
 36
36 -
 37
37 -
 38
38 -
 39
39 -
 40
40 -
 41
41 -
 42
42 -
43
-
44
-
45
-
46
-
47
-
48
-
49
-
50
-
51
-
52
-
53
-
54
-
55
-
56
-
57
-
58
-
59
-
60
-
61
-
62
-
63
-
64
-
65
-
66
-
67
-
68
-
69
-
70
-
71
-
72
-
73
-
74
-
75
-
76
-
77
-
78
-
79
-
80
-
81
-
82
-
83
-
84
-
85
-
86
-
87
-
88
 |
 |

18
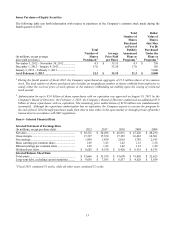
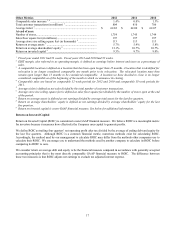
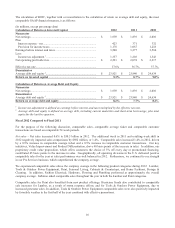
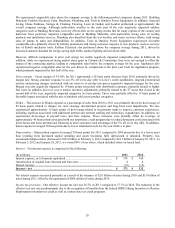
The calculation of ROIC, together with a reconciliation to the calculation of return on average debt and equity, the most
comparable GAAP financial measure, is as follows:
(In millions, except percentage data)
Calculation of Return on Invested Capital 2012 2011 2010
Numerator
N
et earnings .......................................................................................... $ 1,959 $ 1,839 $ 2,010
Plus:
Interest expense - net ......................................................................... 423 371 332
Provision for income taxes ................................................................ 1,178 1,067 1,218
Earnings before interest and taxes ........................................................ 3,560 3,277 3,560
Less:
Income tax adjustment 1 .................................................................... 1,337 1,203 1,343
N
et operating profit after tax ................................................................ $ 2,223 $ 2,074 $ 2,217
Effective tax rate ................................................................................... 37.6% 36.7% 37.7%
Denominator
Average debt and equity 2 ..................................................................... $ 23,921 $ 23,940 $ 24,634
Return on invested capital ................................................................. 9.3% 8.7% 9.0%
Calculation of Return on Average Debt and Equity
Numerator
N
et earnings .......................................................................................... $ 1,959 $ 1,839 $ 2,010
Denominator
Average debt and equity 2 ..................................................................... $ 23,921 $ 23,940 $ 24,634
Return on average debt and equity ................................................... 8.2% 7.7% 8.2%
1 Income tax adjustment is defined as earnings before interest and taxes multiplied by the effective tax rate.
2 Average debt and equity is defined as average debt, including current maturities and short-term borrowings, plus total
equity for the last five quarters.
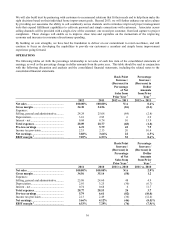
Fiscal 2012 Compared to Fiscal 2011
For the purpose of the following discussion, comparable sales, comparable average ticket and comparable customer
transactions are based on comparable 52-week periods.
Net sales – Net sales increased 0.6% to $50.5 billion in 2012. The additional week in 2011 and resulting week shift in
2012 negatively impacted sales comparisons by $692 million, or 1.4%. Comparable sales increased 1.4% in 2012, driven
by a 0.9% increase in comparable average ticket and a 0.5% increase in comparable customer transactions. Our key
initiatives, Value Improvement and Product Differentiation, drove 40 basis points of the increase in sales. In addition, our
proprietary credit value proposition, which offers customers the choice of 5% off every day or promotional financing,
contributed 65 basis points to the increase in sales. Geographically, all operating divisions in the U.S. delivered positive
comparable sales for the year as sales performance was well balanced in 2012. Furthermore, we continued to see strength
in our Pro Services business, which outperformed the company average.
We experienced comparable sales above the company average in the following product categories during 2012: Lumber,
Tools & Outdoor Power Equipment, Paint, Seasonal Living, Cabinets & Countertops, and Home Fashions, Storage &
Cleaning. In addition, Fashion Electrical, Hardware, Flooring and Plumbing performed at approximately the overall
company average. Inflation aided comparable sales throughout the year in both the Lumber and Paint categories.
Comparable sales for Paint also benefited from new product offerings. Hurricane Sandy also contributed to comparable
sale increases for Lumber, as a result of storm response efforts, and for Tools & Outdoor Power Equipment, due to
increased generator sales. In addition, Tools & Outdoor Power Equipment comparable sales were also positively impacted
by favorable weather in the first half of the year combined with effective promotions.