Lowe's 2012 Annual Report Download - page 11
Download and view the complete annual report
Please find page 11 of the 2012 Lowe's annual report below. You can navigate through the pages in the report by either clicking on the pages listed below, or by using the keyword search tool below to find specific information within the annual report.-
 1
1 -
 2
2 -
 3
3 -
 4
4 -
 5
5 -
 6
6 -
 7
7 -
 8
8 -
 9
9 -
 10
10 -
 11
11 -
 12
12 -
 13
13 -
 14
14 -
 15
15 -
 16
16 -
 17
17 -
 18
18 -
 19
19 -
 20
20 -
 21
21 -
 22
22 -
23
-
24
-
25
-
26
-
27
-
28
-
29
-
30
-
31
-
32
-
33
-
34
-
35
-
36
-
37
-
38
-
39
-
40
-
41
-
42
-
43
-
44
-
45
-
46
-
47
-
48
-
49
-
50
-
51
-
52
-
53
-
54
-
55
-
56
-
57
-
58
-
59
-
60
-
61
-
62
-
63
-
64
-
65
-
66
-
67
-
68
-
69
-
70
-
71
-
72
-
73
-
74
-
75
-
76
-
77
-
78
-
79
-
80
-
81
-
82
-
83
-
84
-
85
-
86
-
87
-
88
 |
 |

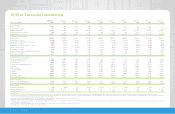
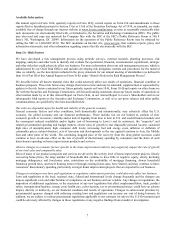
10-Year Financial Information
Lowe’s Companies, Inc. 2012 Annual Report page 9
February 1, February 3, January 28, January 29, January 30, February 1, February 2, February 3, January 28, January 30,
Fiscal Years Ended On 2013 2012* 2011 2010 2009 2008 2007 2006* 2005 2004
Stores and people
Number of stores 1,754 1,745 1,749 1,710 1,649 1,534 1,385 1,234 1,087 952
Square footage (in millions) 197 197 197 193 187 174 157 140 124 109
Number of employees 245,327 248,380 234,318 238,793 228,729 215,978 210,142 185,314 161,964 147,052
Customer transactions (in millions) 804 810 786 766 740 720 680 639 575 521
Average ticket $ 62.82 $ 62.00 $ 62.07 $ 61.66 $ 65.15 $ 67.05 $ 68.98 $67.67 $ 63.43 $ 59.21
Comparative income statements1
Sales (in millions) $50,521 $50,208 $48,815 $47,220 $48,230 $48,283 $46,927 $43,243 $36,464 $30,838
Gross margin (% to sales)234.30% 34.56% 35.14% 34.86% 34.21% 34.64% 34.52% 34.20% 33.56% 30.92%
Selling, general & administrative (% to sales)224.24% 25.08% 24.60% 24.85% 23.17% 22.07% 21.06% 21.17% 21.08% 18.51%
Depreciation (% to sales) 3.01% 2.95% 3.25% 3.42% 3.19% 2.83% 2.48% 2.27% 2.36% 2.40%
Earnings before interest and taxes (% to sales)37.05% 6.53% 7.29% 6.59% 7.85% 9.74% 10.98% 10.76% 10.14% 10.01%
Interest—net (% to sales) 0.84% 0.74% 0.68%w 0.61% 0.58% 0.40% 0.33% 0.37% 0.48% 0.58%
Net earnings (% to sales) 3.88% 3.66% 4.12% 3.78% 4.55% 5.82% 6.62% 6.39% 5.94% 5.91%
Weighted-average shares, assuming dilution (in millions) 1,152 1,273 1,403 1,464 1,468 1,507 1,564 1,607 1,617 1,631
Earnings per share, diluted 1.69 1.43 1.42 1.21 1.49 1.86 1.99 1.73 1.35 1.13
Cash dividends per share 0.62 0.53 0.42 0.36 0.34 0.29 0.18 0.11 0.08 0.06
Comparative balance sheets (millions)
Cash and short-term investments $ 666 $ 1,300 $ 1,123 $ 1,057 $ 661 $ 530 $ 796 $ 876 $ 813 $ 1,624
Merchandise inventory—net 8,600 8,355 8,321 8,249 8,209 7,611 7,144 6,635 5,850 4,482
Total current assets 9,784 10,072 9,967 9,732 9,190 8,633 8,273 7,753 6,842 6,418
Property, less accumulated depreciation 21,477 21,970 22,089 22,499 22,722 21,361 18,971 16,354 13,911 11,819
Total assets 32,666 33,559 33,699 33,005 32,625 30,816 27,726 24,604 21,077 18,647
Accounts payable 4,657 4,352 4,351 4,287 4,109 3,713 3,524 2,832 2,695 2,212
Total current liabilities 7,708 7,891 7,119 7,355 7,560 7,316 6,108 5,449 5,337 3,908
Total debt49,077 7,627 6,573 5,080 6,060 6,680 4,436 3,531 3,690 3,755
Total liabilities 18,809 17,026 15,587 13,936 14,570 14,718 12,001 10,308 9,579 8,459
Shareholders’ equity $13,857 $16,533 $18,112 $19,069 $18,055 $16,098 $15,725 $14,296 $11,498 $10,188
Shares outstanding, year-end 1,110 1,241 1,354 1,459 1,470 1,458 1,525 1,568 1,548 1,575
Cash flows (in millions)
Cash flows from operating activities 3,762 4,349 3,852 4,054 4,122 4,347 4,502 3,842 3,073 3,034
Capital expenditures (Property acquired) 1,211 1,829 1,329 1,799 3,266 4,010 3,916 3,379 2,927 2,345
Financial metrics
Comparable sales growth51.4% 0.0% 1.3% (6.7%)% (7.2%)% (5.1)% 0.0% 6.1% 6.6% 6.7%
Sales per average square foot $ 257 $ 255 $ 250 $ 249 $ 267 $ 292 $ 316 $ 328 $ 314 $ 303
Inventory turnover63.74 3.72 3.63 3.65 3.91 4.06 4.27 4.49 4.50 4.60
Explanatory Notes:
1 Amounts presented for years ended January 30, 2004 and January 31, 2003 reflect the Contractor Yards as a discontinued operation. Net earnings (% to sales) and Earnings per share, diluted attributable to discontinued operations in both years ended January 30, 2004 and January 31, 2003 were 0.05% and $0.01, respectively.
2 The Company adopted EITF 02-16, “Accounting by a Customer (Including a Reseller) for Certain Consideration Received from a Vendor,” for contracts entered into after December 31, 2002. This resulted in certain amounts that were previously accounted for as a reduction in selling, general and administrative expenses being accounted for as a
reduction in cost of sales beginning principally with the fiscal year ending on January 28, 2005.
3 EBIT margin, also referred to as operating margin, is defined as earnings from continuing operations before interest and taxes as a percentage of sales.
4 Total debt is defined as short-term borrowings and long-term debt, including current maturities.
5 Comparable sales growth for years ended February 3, 2012 and February 3, 2006 was calculated using sales for comparable 53 week periods, comparable sales growth for all other years were calculated using sales for comparable 52 week periods. Reference the Management’s Discussion & Analysis section of Lowe’s Companies, Inc. Form 10-K
for the definition of a comparable location.
6 Inventory turnover is calculated by dividing the sum of the last four quarters’ cost of goods sold by the average of the last five quarters’ ending inventory.
* Fiscal 2005 and 2011 were 53 week years. All other years contained 52 weeks.