Lowe's 2012 Annual Report Download - page 28
Download and view the complete annual report
Please find page 28 of the 2012 Lowe's annual report below. You can navigate through the pages in the report by either clicking on the pages listed below, or by using the keyword search tool below to find specific information within the annual report.-
 1
1 -
2
-
3
-
4
-
5
-
6
-
7
-
8
-
9
-
10
-
11
-
12
-
13
-
14
-
15
-
16
-
17
-
 18
18 -
 19
19 -
 20
20 -
 21
21 -
 22
22 -
 23
23 -
 24
24 -
 25
25 -
 26
26 -
 27
27 -
 28
28 -
 29
29 -
 30
30 -
 31
31 -
 32
32 -
 33
33 -
 34
34 -
 35
35 -
 36
36 -
 37
37 -
 38
38 -
39
-
40
-
41
-
42
-
43
-
44
-
45
-
46
-
47
-
48
-
49
-
50
-
51
-
52
-
53
-
54
-
55
-
56
-
57
-
58
-
59
-
60
-
61
-
62
-
63
-
64
-
65
-
66
-
67
-
68
-
69
-
70
-
71
-
72
-
73
-
74
-
75
-
76
-
77
-
78
-
79
-
80
-
81
-
82
-
83
-
84
-
85
-
86
-
87
-
88
 |
 |
14
Item 7 - Management's Discussion and Analysis of Financial Condition and Results of Operations
The following discussion and analysis summarizes the significant factors affecting our consolidated operating results,
financial condition, liquidity and capital resources during the three-year period ended February 1, 2013 (our fiscal years
2012, 2011 and 2010). Fiscal year 2011 contains 53 weeks of operating results compared to fiscal years 2012 and 2010
which contain 52 weeks. Unless otherwise noted, all references herein for the years 2012, 2011 and 2010 represent the
fiscal years ended February 1, 2013, February 3, 2012 and January 28, 2011, respectively. We intend for this discussion to
provide the reader with information that will assist in understanding our financial statements, the changes in certain key
items in those financial statements from year to year, and the primary factors that accounted for those changes, as well as
how certain accounting principles affect our financial statements. This discussion should be read in conjunction with our
consolidated financial statements and notes to the consolidated financial statements included in this Annual Report on
Form 10-K that have been prepared in accordance with accounting principles generally accepted in the United States of
America. This discussion and analysis is presented in seven sections:
• Executive Overview
• Operations
• Lowe’s Business Outlook
• Financial Condition, Liquidity and Capital Resources
• Off-Balance Sheet Arrangements
• Contractual Obligations and Commercial Commitments
• Critical Accounting Policies and Estimates
EXECUTIVE OVERVIEW
During 2012, we made progress on our key initiatives, continuing our journey to become the customer’s first choice in
home improvement. The economic environment showed signs of improvement as fiscal 2012 represented the first year of
growth across all of the core housing metrics: housing turnover, single-family starts, and median home prices. These
recent positive trends helped consumers regain confidence in both the local housing markets and their home values.
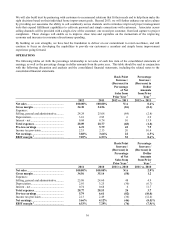
Consequently, we were able to deliver solid results for the year. Net earnings for 2012 increased 6.5% to $2.0 billion and
diluted earnings per share increased 18.2% to $1.69. Net sales for 2012 increased 0.6% to $50.5 billion. Fiscal 2011
contained an extra week which contributed $766 million to 2011 net sales or $0.05 to diluted earnings per share.
Comparable sales were 1.4%, driven by a 0.9% increase in comparable average ticket and a 0.5% increase in comparable
transactions.
For 2012, cash flows from operating activities were approximately $3.8 billion, with $1.2 billion used for capital
expenditures. Our strong financial position and positive cash flows provided us with the ability to make strategic
investments in our core business and to return cash to shareholders through both dividends and share repurchases. During
fiscal 2012, we paid $704 million in dividends and repurchased approximately 146 million shares of common stock for a
total of $4.35 billion under our share repurchase program.
Continuing our journey
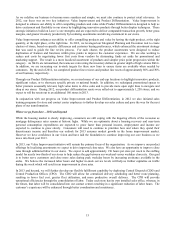
In 2012, we continued to deliver on our commitment to retail excellence by building on our core strengths, while
developing capabilities to provide seamless support across channels and a simplified home improvement experience.
To further deliver a seamless and simple experience, we continued to upgrade our IT infrastructure and gave customers and
associates greater access to information and products through enhanced mobile technology, MyLowes, and flexible
fulfillment. In 2012, we made additional improvements to our associates’ iPhone® capabilities to enable them to deliver
better customer experiences in the aisle by giving them immediate access to the information they need, such as the ability
to identify available rebates. Our MyLowes customer base also continues to grow. Since the launch of MyLowes in late
2011, there have been over 18 million unique key fob swipes and over 5 million cardholders have registered their cards on
MyLowes. We also experienced strong customer response to our iPhone® and AndroidTM mobile applications which have
grown to represent approximately 20% of overall Lowes.com traffic. In addition, flexible fulfillment now allows us to
deliver in-stock Lowes.com parcel orders to customers in over 90% of US markets within 24 hours at standard shipping
rates.