Lowe's 2012 Annual Report Download - page 46
Download and view the complete annual report
Please find page 46 of the 2012 Lowe's annual report below. You can navigate through the pages in the report by either clicking on the pages listed below, or by using the keyword search tool below to find specific information within the annual report.-
 1
1 -
2
-
3
-
4
-
5
-
6
-
7
-
8
-
9
-
10
-
11
-
12
-
13
-
14
-
15
-
16
-
17
-
18
-
19
-
20
-
21
-
22
-
23
-
24
-
25
-
26
-
27
-
28
-
29
-
30
-
31
-
32
-
33
-
34
-
35
-
 36
36 -
 37
37 -
 38
38 -
 39
39 -
 40
40 -
 41
41 -
 42
42 -
 43
43 -
 44
44 -
 45
45 -
 46
46 -
 47
47 -
 48
48 -
 49
49 -
 50
50 -
 51
51 -
 52
52 -
 53
53 -
 54
54 -
 55
55 -
 56
56 -
57
-
58
-
59
-
60
-
61
-
62
-
63
-
64
-
65
-
66
-
67
-
68
-
69
-
70
-
71
-
72
-
73
-
74
-
75
-
76
-
77
-
78
-
79
-
80
-
81
-
82
-
83
-
84
-
85
-
86
-
87
-
88
 |
 |

32
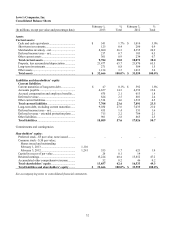
Lowe’s Companies, Inc.
Consolidated Balance Sheets
(In millions, except par value and percentage data)
February 1,
2013
%
Total
February 3,
2012
%
Total
Assets
Current assets:
Cash and cash equivalents .................................... $ 541 1.7 % $ 1,014 3.0%
Short-term investments......................................... 125 0.4 286 0.9
Merchandise inventory - net ................................. 8,600 26.3 8,355 24.9
Deferred income taxes - net .................................. 217 0.7 183 0.5
Other current assets .............................................. 301 0.9 234 0.7
Total current assets ............................................ 9,784 30.0 10,072 30.0
Property, less accumulated depreciation .............. 21,477 65.7 21,970 65.5
Long-term investments ......................................... 271 0.8 504 1.5
Other assets .......................................................... 1,134 3.5 1,013 3.0
Total assets .......................................................... $ 32,666 100.0 % $ 33,559 100.0%
Liabilities and shareholders’ equity
Current liabilities:
Current maturities of long-term debt .................... $ 47 0.1 % $ 592 1.8%
Accounts payable ................................................. 4,657 14.3 4,352 13.0
Accrued compensation and employee benefits..... 670 2.1 613 1.8
Deferred revenue .................................................. 824 2.5 801 2.4
Other current liabilities ......................................... 1,510 4.6 1,533 4.5
Total current liabilities ...................................... 7,708 23.6 7,891 23.5
Long-term debt, excluding current maturities ...... 9,030 27.6 7,035 21.0
Deferred income taxes - net .................................. 455 1.4 531 1.6
Deferred revenue - extended protection plans ...... 715 2.2 704 2.1
Other liabilities ..................................................... 901 2.8 865 2.5
Total liabilities .................................................... 18,809 57.6 17,026 50.7
Commitments and contingencies
Shareholders’ equity:
Preferred stock - $5 par value, none issued .......... - - - -
Common stock - $.50 par value;
Shares issued and outstanding
February 1, 2013 ............................................... 1,110
February 3, 2012 ............................................... 1,241 555 1.7 621 1.9
Capital in excess of par value ............................... 26 0.1 14 -
Retained earnings ................................................. 13,224 40.4 15,852 47.2
Accumulated other comprehensive income .......... 52 0.2 46 0.2
Total shareholders’ equity ................................. 13,857 42.4 16,533 49.3
Total liabilities and shareholders’ equity ......... $ 32,666 100.0 % $ 33,559 100.0%
See accompanying notes to consolidated financial statements.