Lowe's 2012 Annual Report Download - page 70
Download and view the complete annual report
Please find page 70 of the 2012 Lowe's annual report below. You can navigate through the pages in the report by either clicking on the pages listed below, or by using the keyword search tool below to find specific information within the annual report.-
 1
1 -
2
-
3
-
4
-
5
-
6
-
7
-
8
-
9
-
10
-
11
-
12
-
13
-
14
-
15
-
16
-
17
-
18
-
19
-
20
-
21
-
22
-
23
-
24
-
25
-
26
-
27
-
28
-
29
-
30
-
31
-
32
-
33
-
34
-
35
-
36
-
37
-
38
-
39
-
40
-
41
-
42
-
43
-
44
-
45
-
46
-
47
-
48
-
49
-
50
-
51
-
52
-
53
-
54
-
55
-
56
-
57
-
58
-
59
-
 60
60 -
 61
61 -
 62
62 -
 63
63 -
 64
64 -
 65
65 -
 66
66 -
 67
67 -
 68
68 -
 69
69 -
 70
70 -
 71
71 -
 72
72 -
 73
73 -
 74
74 -
 75
75 -
 76
76 -
 77
77 -
 78
78 -
 79
79 -
 80
80 -
81
-
82
-
83
-
84
-
85
-
86
-
87
-
88
 |
 |

56
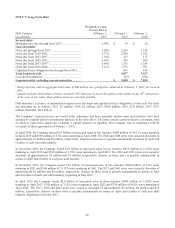
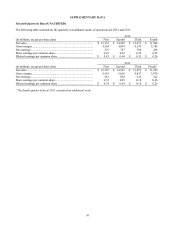
SUPPLEMENTARY DATA
Selected Quarterly Data (UNAUDITED)
The following table summarizes the quarterly consolidated results of operations for 2012 and 2011:
2012
(In millions, except per share data) First Second Third Fourth
N
et sales ........................................................................................... $ 13,153 $ 14,249 $ 12,073 $ 11,046
Gross margin .................................................................................... 4,564 4,834 4,143 3,785
N
et earnings ..................................................................................... 527 747 396 288
Basic earnings per common share .................................................... 0.43 0.64 0.35 0.26
Diluted earnings per common share ................................................ $ 0.43 $ 0.64 $ 0.35 $ 0.26
2011
(In millions, except per share data) First Second Third Fourth 1
N
et sales ........................................................................................... $ 12,185 $ 14,543 $ 11,852 $ 11,629
Gross margin .................................................................................... 4,319 5,016 4,037 3,979
N
et earnings ..................................................................................... 461 830 225 322
Basic earnings per common share .................................................... 0.35 0.65 0.18 0.26
Diluted earnings per common share ................................................ $ 0.34 $ 0.64 $ 0.18 $ 0.26
1 The fourth quarter of fiscal 2011 contained an additional week.