Lowe's 2012 Annual Report Download - page 57
Download and view the complete annual report
Please find page 57 of the 2012 Lowe's annual report below. You can navigate through the pages in the report by either clicking on the pages listed below, or by using the keyword search tool below to find specific information within the annual report.-
 1
1 -
2
-
3
-
4
-
5
-
6
-
7
-
8
-
9
-
10
-
11
-
12
-
13
-
14
-
15
-
16
-
17
-
18
-
19
-
20
-
21
-
22
-
23
-
24
-
25
-
26
-
27
-
28
-
29
-
30
-
31
-
32
-
33
-
34
-
35
-
36
-
37
-
38
-
39
-
40
-
41
-
42
-
43
-
44
-
45
-
46
-
 47
47 -
 48
48 -
 49
49 -
 50
50 -
 51
51 -
 52
52 -
 53
53 -
 54
54 -
 55
55 -
 56
56 -
 57
57 -
 58
58 -
 59
59 -
 60
60 -
 61
61 -
 62
62 -
 63
63 -
 64
64 -
 65
65 -
 66
66 -
 67
67 -
68
-
69
-
70
-
71
-
72
-
73
-
74
-
75
-
76
-
77
-
78
-
79
-
80
-
81
-
82
-
83
-
84
-
85
-
86
-
87
-
88
 |
 |

43
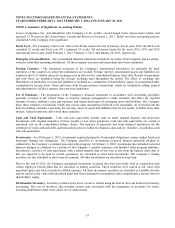
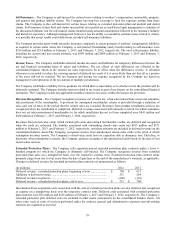
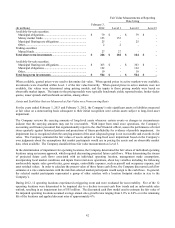
The remaining seven operating locations that experienced a triggering event during 2012 were determined to be
recoverable and therefore were not impaired. For these seven locations, the expected undiscounted cash flows substantially
exceeded the net book value of the location’s assets. A 10% reduction in projected sales used to estimate future cash flows
at the latest date these seven operating locations were evaluated for impairment would have resulted in the impairment of
four of these locations and increased recognized impairment losses by $47 million. We analyzed other assumptions made
in estimating the future cash flows of the operating locations evaluated for impairment, but the sensitivity of those
assumptions was not significant to the estimates.
In the determination of impairment for locations identified for closure and for excess properties held-for-use and held-for-
sale, which consisted of retail outparcels and property associated with relocated or closed locations, the fair values were
determined using a market approach based on estimated selling prices. The Company determined the estimated selling
prices by obtaining information from property brokers or appraisers in the specific markets being evaluated or negotiated
non-binding offers to purchase. The information obtained from property brokers or appraisers included comparable sales
of similar assets and assumptions about demand in the market for these assets.
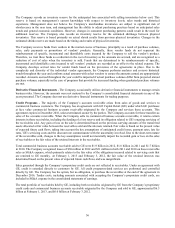
During 2012, the Company incurred total impairment charges of $21 million for 22 excess property locations. A 10%
reduction in the estimated selling prices for these excess properties at the dates the locations were evaluated for impairment
would have increased impairment losses by approximately $4 million.
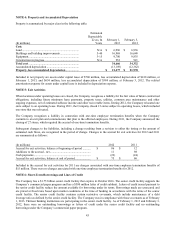
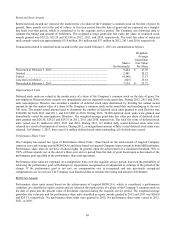
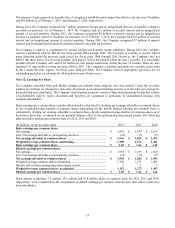
The following tables present the Company’s non-financial assets measured at estimated fair value on a nonrecurring basis
and the resulting long-lived asset impairment losses included in earnings, excluding costs to sell for excess properties held-
for-sale. Because assets subject to long-lived asset impairment were not measured at fair value on a recurring basis, certain
fair value measurements presented in the table may reflect values at earlier measurement dates and may no longer represent
the fair values at February 1, 2013 and February 3, 2012.
Fair Value Measurements - Nonrecurring Basis
February 1, 2013 February 3, 2012
(In millions)
Fair Value
Measurements
Impairment
Losses
Fair Value
Measurements
Impairment
Losses
Assets held-for-use:
Operating locations ............................................... $ 19 $ (55) $ 16 $ (40)
Locations identified for closure ............................. - - 72 (269)
Excess properties ................................................... 33 (17) 117 (78)
Assets held-for-sale:
Excess properties ................................................... 8 (4) 2 (1)
Total ......................................................................... $ 60 $ (76) $ 207 $ (388)
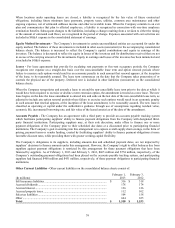
Fair Value of Financial Instruments
The Company’s financial instruments not measured at fair value on a recurring basis include cash and cash equivalents,
accounts receivable, accounts payable, accrued liabilities and long-term debt and are reflected in the financial statements at
cost. With the exception of long-term debt, cost approximates fair value for these items due to their short-term nature. The
fair values of the Company’s unsecured notes classified as Level 1 were estimated using quoted market prices. The fair
values of the Company’s mortgage notes classified as Level 2 were estimated using discounted cash flow analyses, based
on the future cash outflows associated with these arrangements and discounted using the applicable risk-free borrowing
rate.
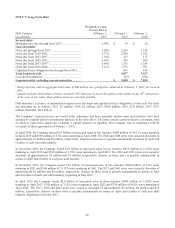
Carrying amounts and the related estimated fair value of the Company’s long-term debt, excluding capitalized lease
obligations, are as follows:
February 1, 2013 February 3, 2012
(In millions)
Carrying
Amoun
t
Fai
r
Value
Carrying
Amount
Fai
r
Value
Unsecured notes (Level 1) ............................................................... 8,627 9,860 7,189 8,250
Mortgage notes (Level 2) ................................................................. 19 22 20 24
Long-term debt (excluding capitalized lease obligations) .......... $ 8,646 $ 9,882 $ 7,209 $ 8,274